Earth Work
|
1. Create a folder called Earth_work somewhere under your personal directory (e.g. C:\Users\jdoe\Documents\Tutorials\Earth_work). 2. Download the Earth_work.zip data for this exercise and extract the files to your newly created Earth_work directory. |
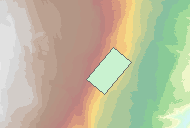
In this fictitious scenario, a partially bermed building is proposed for the campus’ south-east sloping hill. The goal is to estimate whether or not external fill will be needed for the project (i.e. will there be enough earth removed from the hill to fill in the exposed slope for the building footprint or will fill need to be trucked in).
Note that this tutorial will make use of the Spatial Analyst, so make sure to enable this extension from the pull-down menu under Customize >> Extensions.
Step 2: Convert polygon layer to raster layer
Step 3: Calculate the difference in elevation
Step 4: Net removal or net fill?
Open the Earth_work.mxd file.
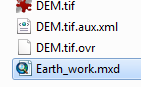
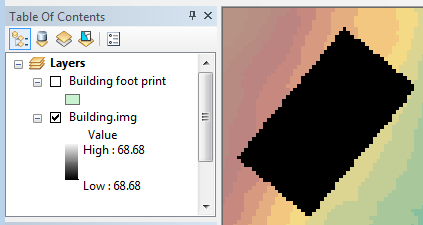
The document consists of two layers: a building footprint layer and a DEM (elevation in meters) layer.
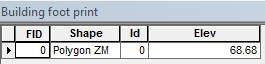
The building’s base is to be set at an elevation of 68.68 meters. Note that this value is stored in the shapefile’s attribute table. We’ll be using this attribute value to convert the shapefile to a raster.
In Arctoobox, go to Conversion Tools >> To Raster >> Polygon to Raster and enter the values as shown below (make sure that the output raster is saved in your working project).
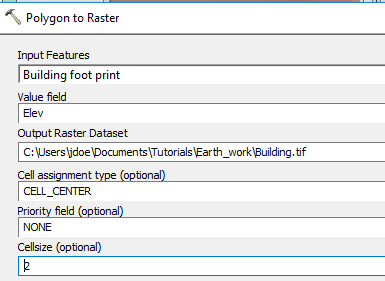
Since we are creating a new raster, it may be best to ensure that the pixel size and layout match those of the existing DEM raster:
Modify the tool’s Environments setting by setting the Snap Raster and the Raster Cell Size to that of the DEM.
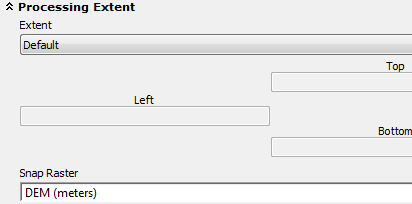
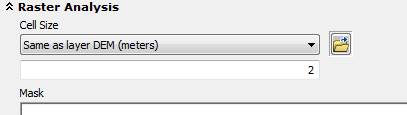
Click OK to close the Environments window and OK again to run the geoprocess.
The output should be a raster with uniform pixel values of 68.68 m.
Next, we will create a raster that will give us the difference in elevation values between the building’s base level and the background elevation.
Open Spatial Analyst Tools >> Map Algebra >> Raster Calculator and type out the expression as shown below.
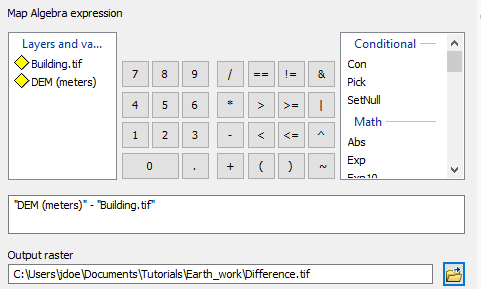
Click OK to run the geoprocess.
The output raster should have values ranging from -5.24 to +2.68. A positive value indicates that earth has to be removed from the hill to accommodate the building footprint and a negative value indicates that earth needs to be added. Note that the values are in meters and represent depth of excavation or of fill for each pixel. If your values differ slightly from those shown in this tutorial than you might not have properly set the Environment settings outlined in Step 2.
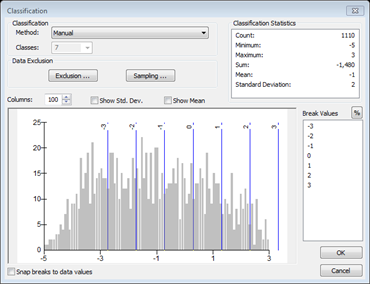
Use a divergent color scheme to highlight the areas to be filled or removed. You might want to use the Classify option to fine tune the bin cutoffs.
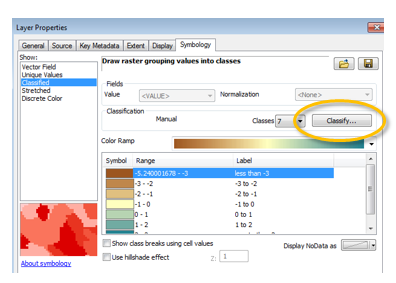
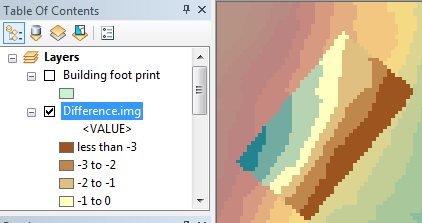
Your map should look like this (with greens indicating removal and browns indicating fill).
Step 4: Net removal or net fill? (Option 1)
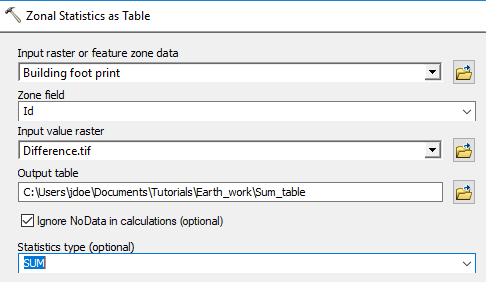
Since each pixel covers 2m x 2m = 4m², we can multiply this amount by the sum of pixel values to get a total fill/removal volume. One way to extract the sum of pixel values is to run the zonal statistics tool.
Open Spatial Analyst Tools >> Zonal >> Zonal Statistics as Table and fill the fields as follows:
Click OK to run the geoprocess.
A table should be added to your TOC.
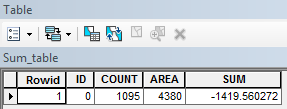
The sum of values is -1419.6 meters. To get total volume, multiply this amount by the area of each pixel (4m): -1419.6m x 4m² = -5678.4 m3. Since the value is negative, fill will need to be trucked in for the construction of the new building.
Step 5: Net removal or net fill? (Option 2)
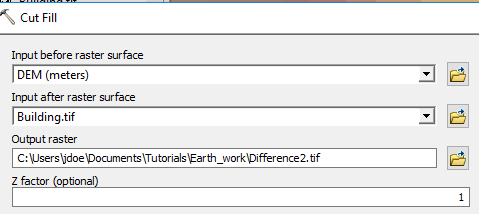
Another way to estimate the amount of fill to add or to remove is to use the Cut Fill tool.
Open Spatial Analyst Tools >> Surface >> Cut Fill and fill the fields as follows:
Click OK to run the geoprocess.
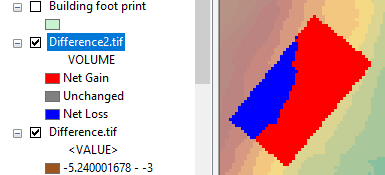
The output is a raster symbolized to show gains and losses in elevation.
The output is an integer raster which implies that an attribute table is present.
Right-click on the Difference2.tif raster and open its attribute table.
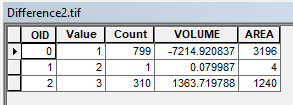
The pixel values are broken down into three values: 1 (net gain), 2 (no change), and 3 (net loss). The Count column lists the number of pixels assigned to each value. The raster also provides us with a Volume column saving us from having to compute these values manually. Summing this column results in a net volume of -5851 m3. This value is about 3% greater than the one computed in the last step. This difference could be due to rounding errors.
![]() Manuel Gimond, last modified on 7/16/2018
Manuel Gimond, last modified on 7/16/2018