Joining Tables to Maps
|
1. Create a folder called Table_join somewhere under your personal directory (e.g. C:\Users\jdoe\Documents\Tutorials\Table_join). 2. Download the data for this exercise then uncompress the Table_join.zip file to your newly created Table_join directory. |
Note: If you are working with Excel data files, you may need to install the 2007 Office System Driver (this driver is already installed on GIS lab PCs).
This exercise will introduce you to joining (non-spatial) data tables to existing GIS data files. You will join two data table type: an Excel file and a CSV file.
Step 1: Create a new map document
Step 2: A note about field names if using version 10.3 or older
Step 3: Joining an Excel table to a layer
Step 4: Exporting a join to a new shapefile
Step 5: Attempting a join (and failing)
Step 6: Converting text column to numeric column
Step 7: Attempting the join one more time
You will create a new ArcMap document where you will load the Maine counties layer.
From the Windows menu ![]() , open ArcGIS >> ArcMap
10.x.
, open ArcGIS >> ArcMap
10.x.
In the ArcMap – Getting Started window, select New Maps and Blank Map as the template.
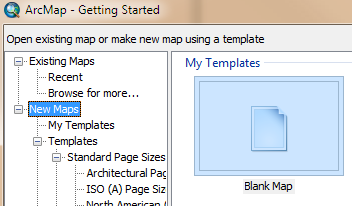
Click OK.
Next, you will load a new layer. The following step assumes that you don’t have a folder connection to this project’s workspace.
Click on the Add Data button ![]() .
.
If a folder connection to your workplace does not yet
exist, click on the Connect to Folder button ![]() then select your Table_join
folder.
then select your Table_join
folder.
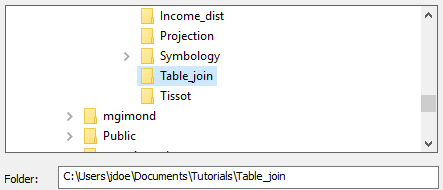
Click OK to close the Connect to Folder window.
You should now see a list of data elements in the new folder connection.
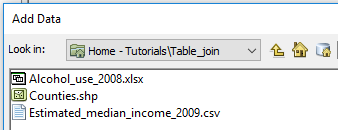
Select Counties then click on the Add button.
Both CSV files and Excel files can be read into an ArcMap document. However, if you are using a version of ArcMap 10.3 or older, read the following warning box.
|
!! |
If you are using ArcMap 10.3 or older, the software has strict guidelines when it comes to importing tables into ArcMap. Table field names cannot contain non-alphanumeric characters such percent signs. It also cannot contain spaces, even at the beginning or end of the field name. ArcMap will accept underscores ‘_’ as a space substitute. A summary of field name requirements follow: · Field names need to start with a letter. · Field names should only include alphanumeric characters or underscores. - None of these: `~@#$%^&*()-+=|\\,<>?/{}.!'[]:; - No spaces (That includes before the field name, in the middle, or after it. · Field names will be cut off after 64 characters · There are certain reserved words that should be avoided. You can see the complete list here. |
Now that you have a new map document open, you will add a table to your map. The data file Alcohol_use_2008.xlsx is an Excel file that tabulates the percentage of students between grades 6 and 12 who have consumed alcohol at least once. More information about the data can be found here.
In ArcMap click on the Add Data button ![]() .
.
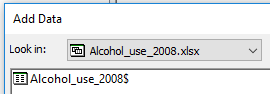
Excel files can store multiple sheets (tabs) however, ArcMap
will read just one sheet at a time. This Excel file has a single sheet ![]() .
.
In the Table_join project folder double-click on Alcohol_use_2008.xlsx to expose its datasheet.
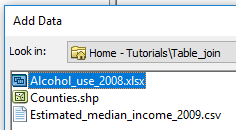
Select the worksheet and click Add.
You should now see the table in the TOC.
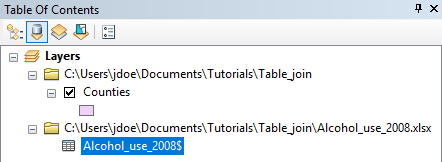
You may notice that the TOC environment has changed. Since
tables cannot be viewed in the standard List By Drawing Order ![]() environment, ArcMap switched the TOC to
the List By Source environment
environment, ArcMap switched the TOC to
the List By Source environment ![]() . Don’t forget that you
can toggle back and forth between these TOC views by clicking on the
appropriate button near the top of the TOC window pane.
. Don’t forget that you
can toggle back and forth between these TOC views by clicking on the
appropriate button near the top of the TOC window pane.
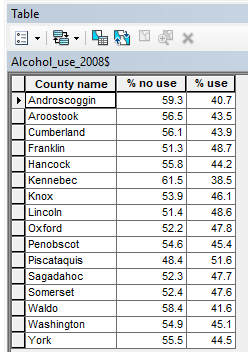
Right-click on the Alcohol_use_2008 table and select Open.
The table should look just as it does in Excel.
Next, we will join this table to the existing data layer (Counties) in the ArcMap document. To join a table, to an existing layer, a field common to both tables must exist. Let’s view the Counties layer’s attribute table.
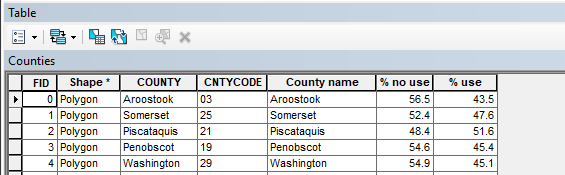
In the TOC, right-click on Counties and select Open Attribute Table.
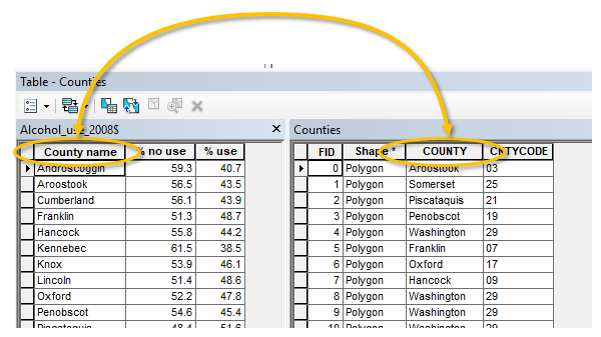
The Counties layer has an attribute called COUNTY that will be keyed to Excel’s County_name field. Note that a successful join requires that all records in both tables be identical--character for character. This means that a discrepancy as benign as a character’s case (upper case vs lower case) will result in an unsuccessful join. Note too that you do not need to have the same number of records in both tables. The join can be one-to-many (i.e. one record in the Excel file can be joined to multiple records in the data layer).
In the TOC, right-click on the Counties layer and select Joins and Relates >> Join.
In the Join Data window select Join attributes from a table in the first pull-down menu, COUNTY in the first field, Alcohol_use_2008 in the second field and County name in the third field (see graphic below).
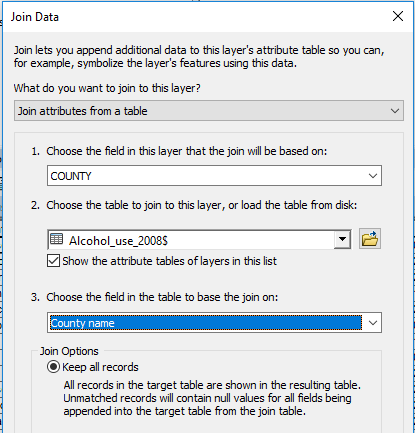
Click OK to close the Join Data window.
In the Counties attribute table you should see the attribute columns from the Excel appended to the end of the Counties attribute table.
At this point, you can work with the appended attributes as though they belonged to the original Counties layer.
In the TOC, right-click on the Counties layer and select Properties.
In the Layer Properties window, select the Symbology tab.
Select Quantities in the Show window on the left side of the Layer Properties window.
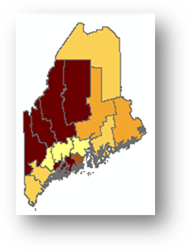
Select % use for the Value field.
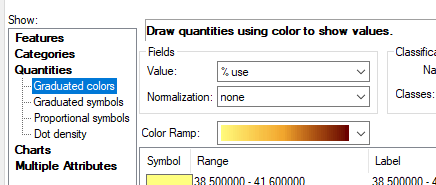
Click OK to close the Layer Properties window.
It’s always good practice to save your map document on a regular basis. Now is a good time to do so.
From the File pull-down menu, select File >> Save As.
In the Save As window, navigate to the Table_join folder and save the document as Join_exercise.mxd.
The join that you have created so far is only temporary and exists “virtually” within the current ArcMap session. In other words, if you were to load the Counties layer into a new MXD document, the join would be gone. To make the join permanent, you need to export the layer (and its joined table) to a new feature.
In the TOC, right-click on the Counties layer and select Data >> Export Data.
In the Export Data window select All features from the Export pull-down menu and name the output Alcohol_by_county.shp (make sure to save it as a shapefile and not a geodatabase file).
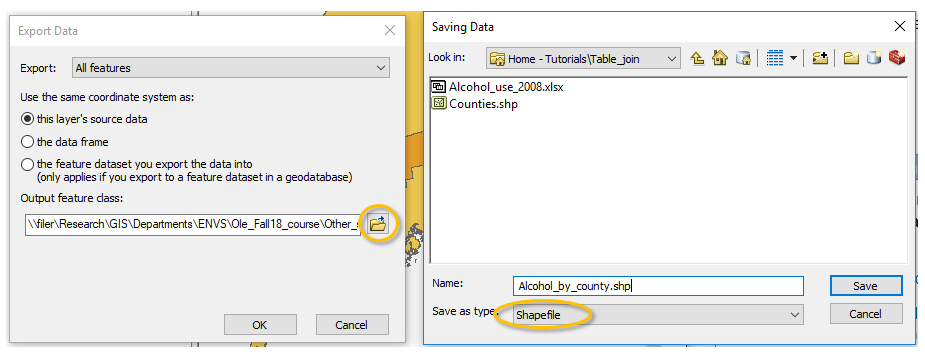
Click OK to save the file.
When prompted to add the exported data to the map, click Yes.
Note: when exporting to a shapefile, field names longer than 10 characters will be truncated to the first ten characters. Also, spaces and non-alphanumeric characters get converted to underscores and letters.
It’s usually good practice to import tables with simple field names as outlined in Step 2 even though it will not impede an ArcMap workflow.
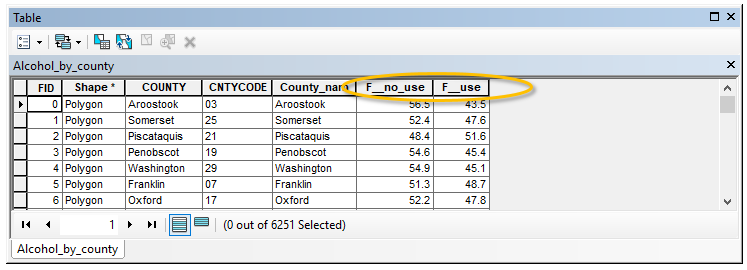
Go ahead and symbolize the new layer as you did with the original one near the end of step 3. You will use the F__use attribute for the field value.
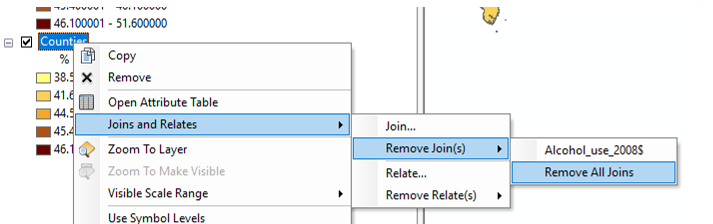
Next, you will remove the join from the original Counties layer.
In the TOC, right-click on Counties and select Joins and Relates >> Remove Join(s) >> Remove All Joins.
Save the document by clicking on the Save button ![]() .
.
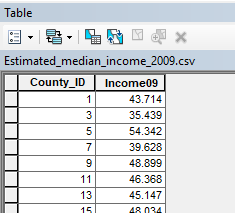
Next, you will join another table to the Counties layer. The table to be joined contains estimated median income data for 2009 (src: US Census). The table is in a CSV file. A CSV stores data that are separated by commas.
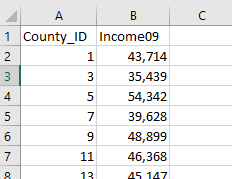
In the Windows file management window, double-click on the Estimated_median_income_2009 file located in the Table_join folder.
The file should open in an Excel application. You’ll first notice that the file stores clean field names that do not risk being modified following a joined layer export as in Step 4. You’ll also notice that the table does not have county names listed, instead, the table identifies the county by ID. This is OK since the Counties layer in the ArcMap document has a county code column called CNTYCODE.
Close the Excel file. If prompted to save click Don’t Save.
NOTE: always make sure to close a data file that is open inside an Excel application before opening it in ArcMap. If you don’t, ArcMap will not properly open the file because of a file lock placed on the file by the Excel application.
In ArcMap, click on the Add Data button ![]() .
.
In the Add Data window, select Estimated_median_income_2009.csv.
Click Add to add the data.
You now should see the median income table in the table of content. At this point, it’s always good practice to open the contents of the table to make sure that all data have been properly read.
In the TOC, right-click on the Estimated_median_income_2009 table and select Open.
It seems that all data and headers were properly imported. Now let’s try the join. Remember that this time around, we will join the data table to the Counties table using the County IDs instead of the County names.
In the TOC, right-click on the Counties layer and select Joins and Relates >> Joins.
In the Join Data window, select Join attributes from a table from the first pull-down option, then CNTYCODE from the second pull-down menu (this is the column from the Counties layer that is used to join the table with) and select Estimated_median_income_2009 in the third pull-down menu.
Now try selecting a field from the Choose the fields in the table to base the join on pull-down menu. The options should be blank.
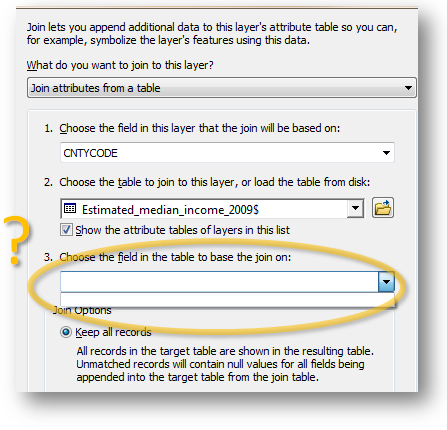
So what happened? Why is ArcMap not letting us select any columns from the Excel table? Well not only do the records between both tables need to match character for character, but they also need to match by data type. So we need to figure out the data types for each table.
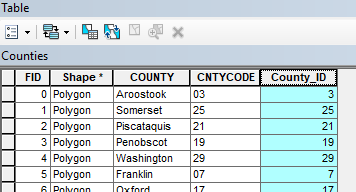
If the data table’s attribute table is not opened, go ahead and open it. (e.g. in the TOC, right-click on the table layer and select open).
In the attribute table, right-click on the County_ID header and select Properties.
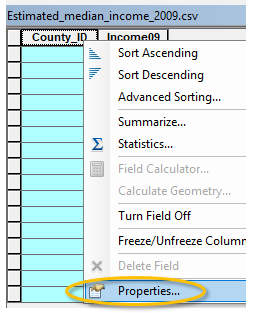
In the Field Properties window, note the data type. The CSV
column was read as a Long data type (which is a numeric data type). 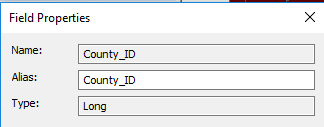
Click OK to close the Field Properties window.
In the TOC, right-click on the Counties layer and select Open Attribute Table.
In the Table window, right-click on the CNTYCODE column header and select Properties.
In this table, the county ID is treated as a String (which is a text or character format) and not a numeric field. Because the data types between both tables do not match, we cannot join the tables. There are several solutions to this problem one of which involves converting the string to a number in ArcMap.
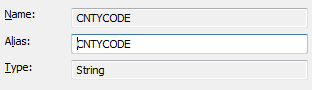
Click OK to close the Field Properties window.
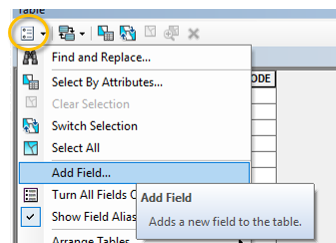
In the Counties’ layer attribute table, select Add Field.
We’ll assign it the same field name used in the CSV file: County_ID.
Since the value to be converted are small integers, we’ll make this field a Short Integer.
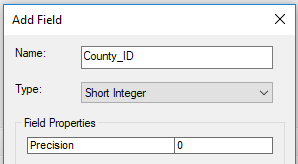
Note that the joined tables do not need to match numeric data type exactly (i.e. a long integer will gladly join to a short integer).
Click OK to create the new field
Right-click on the County_ID column and select Field Calculator. You might be presented with a warning window that you can dismiss.
In the expression box, type [CNTYCODE].
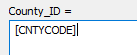
This assigns the values in CNTYCODE to County_ID. ArcMap will convert the values from text to numbers in the process.
Click OK.
Now that we have matching county ID values between the Counties layer and the CSV table we can proceed with the join.
Right-click on the Counties layer and select Joins and Relates >> Joins.
In the Join Data window select the values for each field as shown below:
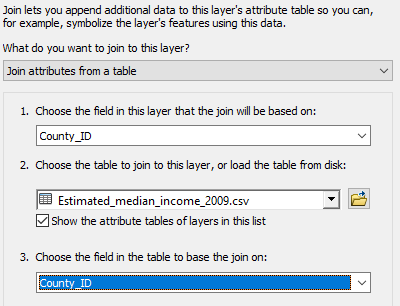
Click OK to close the Join data window.
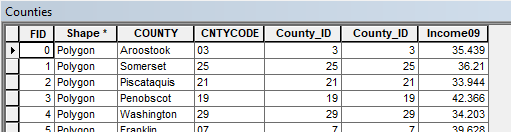
In the TOC, right-click on the Counties layer and select Open Attribute table.
The median income data is now joined to the Counties layer.
Remember that this join is temporary. If you want it to be permanent, you must export it to a new data file.
Before exporting the joined layer to a new data file we will remove unnecessary/redundant attributes.
In the TOC, right-click the Counties layer and select Properties.
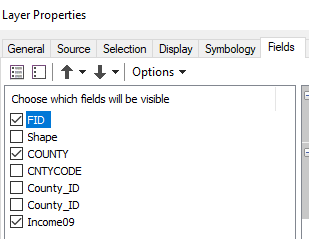
In the Layer Properties window, select Fields.
![]()
This option lets you control which attributes will be useable within your map session. It also defines which attributes will be exported in an export process.
You will uncheck the Shape, CountyCode and County_ID attributes.
Click OK to close the Layer Properties window.
If you view the Counties layer attribute table, you should see just three columns.
Now we are ready to export the layer to a new data file.
In the TOC, right-click on the Counties layer and select Data >> Export Data.
Name the new data file Income_by_county.shp. Make sure to save it as a shapefile.
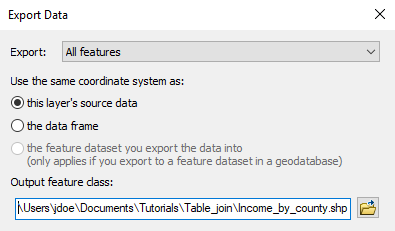
Click OK to proceed with the export.
When asked if the exported data should be added to the map as a layer, click Yes.
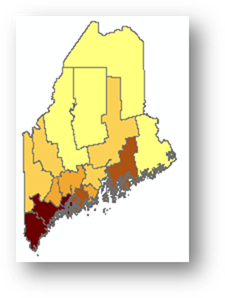
Go ahead and symbolize the newly added layer using the Income09 attribute (this is the estimated median income attribute). If you forgot how to symbolize a layer, see Step 3.
Save the MXD file.
This completes the steps for this exercise.
![]() Manuel Gimond, last modified on 7/12/2018
Manuel Gimond, last modified on 7/12/2018