Labels and Annotations
|
1. Create a folder called Labels somewhere under your personal directory (e.g. C:\Users\jdoe\Documents\Tutorials\Labels). 2. Download the data for this exercise and extract the contents of Labels.zip file to your newly created Labels directory.
|
In this exercise, you will annotate a reference map of the Maine mid-coast region. Steps will include generating dynamic labels (automatically placed by ArcMap) followed by their conversion to geodatabase annotation features. You will then learn how to manually edit/customize the annotations inside of an ArcMap session.
Step 4: Convert labels to annotation
Step 5: Edit college annotations
Step 6: Reposition other college annotations
Step 7: Create county boundary annotations
Step 8: Add rivers and streams annotations
Step 9: Create Urban Areas annotations
Step 10: Add custom annotation
Step 13: Convert road labels to annotations
Step 14: Make final adjustments
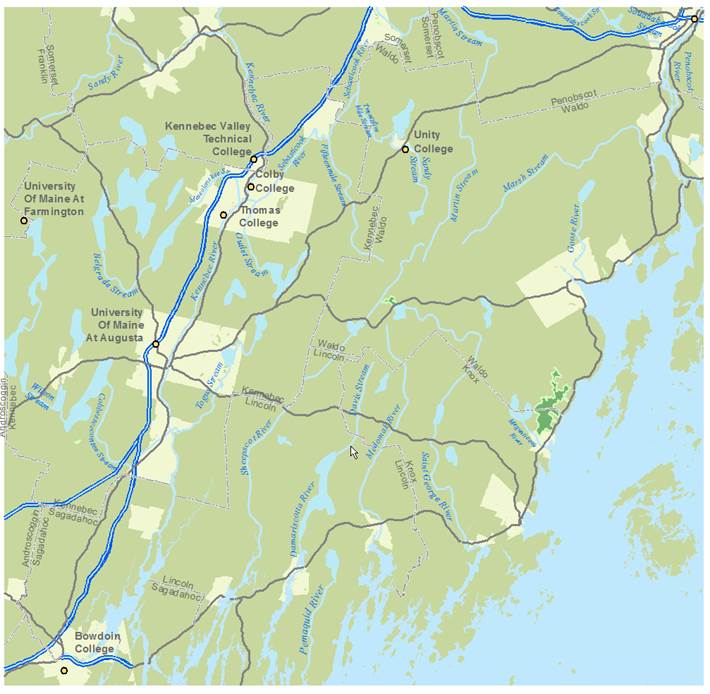
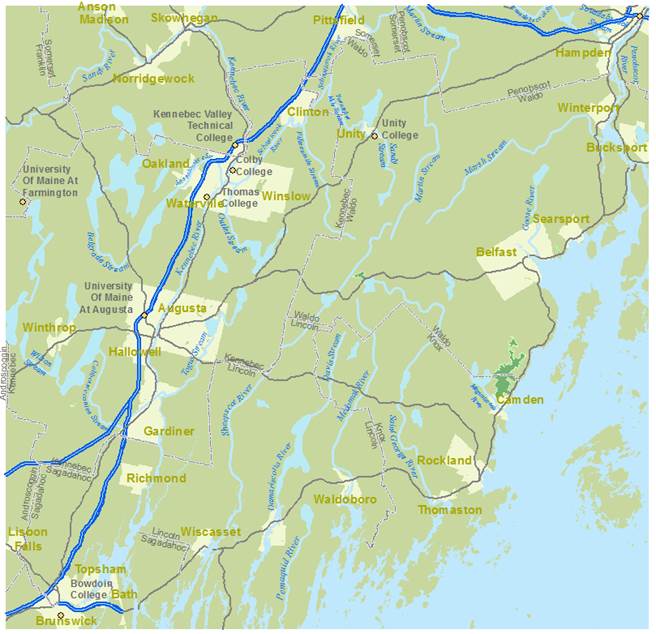
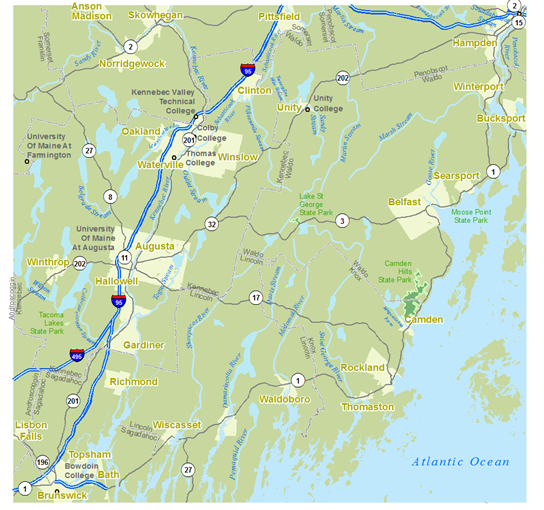
Open the maps.mxd located in your Labels folder.
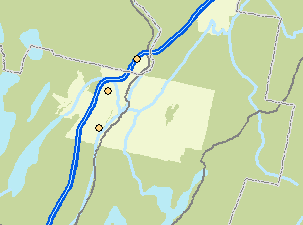
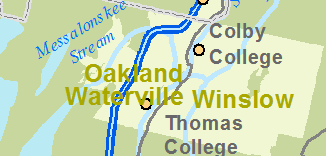
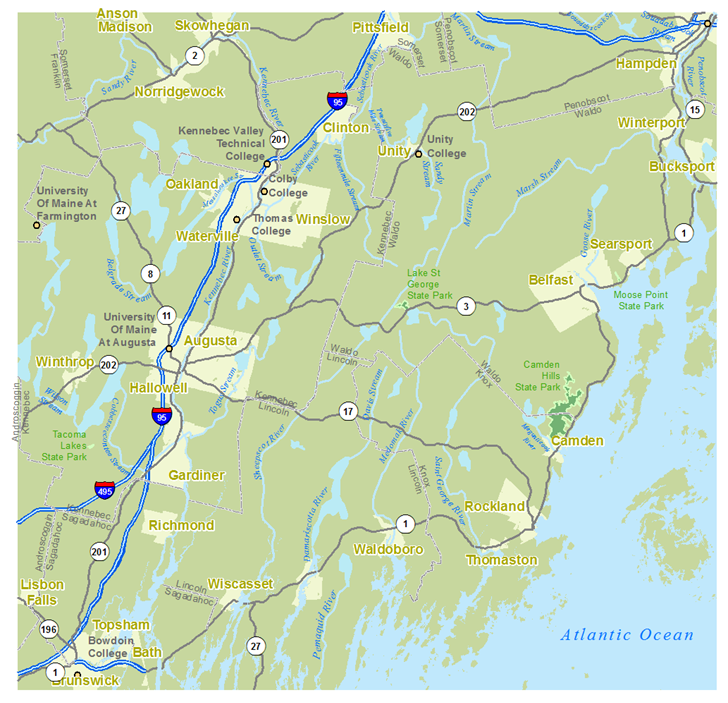
The map represents a section of Maine’s mid-coast region and delineates urban areas, parks, water bodies, counties, roads and Colleges. The goal of this exercise will be to label/annotate these features for the sole purpose of creating a reference map.
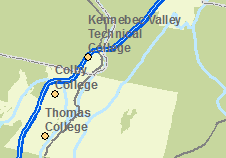
In this step you will have ArcMap automatically place college labels.
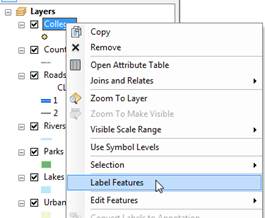
In the TOC, right-click on Colleges and select Label Features.
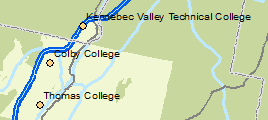
ArcMap uses a default font, color and placement rule to locate the labels. The location and label size (relative to map features) are dynamically adjusted as one pans around and zooms in and out of the map.
In this example, ArcGIS defaulted to the Name attribute field. However, as you will learn later in this exercise, you can select any other attribute value(s) to label.
Next, you will modify the label settings for Colleges.
From the customize pull-down menu, select Toolbars >> Labeling.
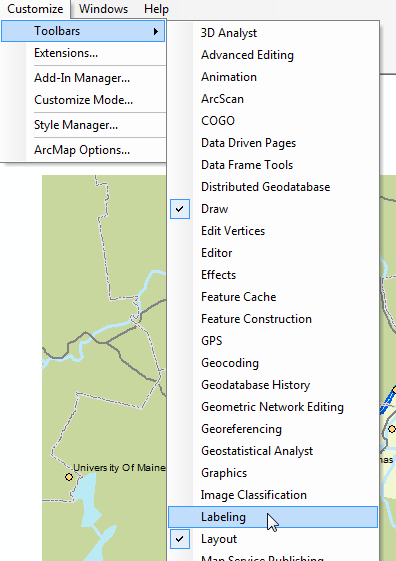
This will bring up the Labeling toolbar.
ArcGIS has an extension called Maplex that offers additional labeling options. This extension is normally purchased separately. All
In the Labeling toolbar, expand the Labeling pull-down menu and select Use Maplex Label Engine.
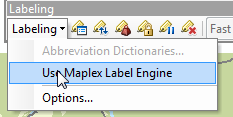
This enables the Maplex label engine. Maplex offers advanced labeling options.
Note that the label characteristics have changed now that we’ve switched to the Maplex label engine.
Next, you will fine tune the label placement options.
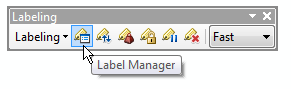
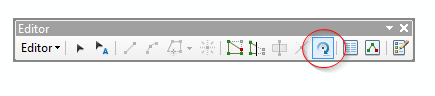
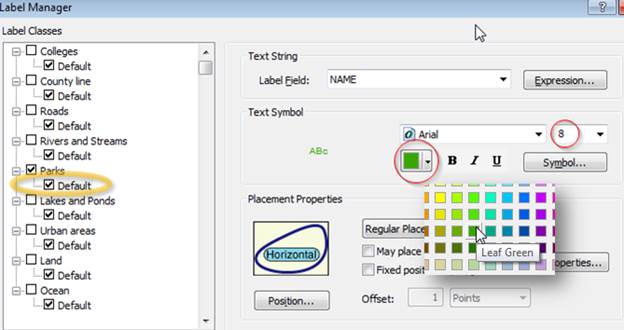
In the Labeling toolbar, click on the Label Manager icon.
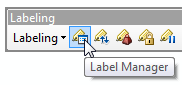
The Label Manager window provides access to all labeling properties. Click here to learn more about the Label Manager window environment.
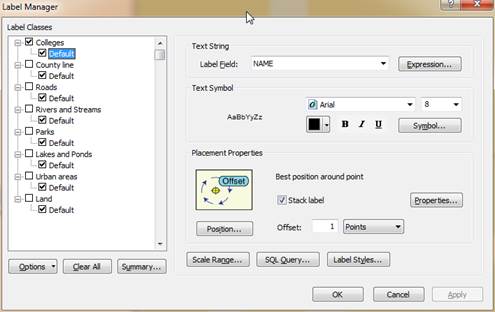
Next, you will change the Colleges label properties using the Label Manager window.
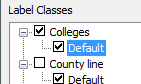
Make sure that the Default label class under Colleges is highlighted in the left window pane.
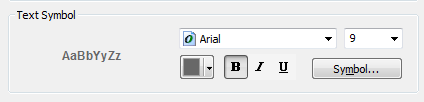
In the Label Manager window, change the following text settings for Colleges:
· Size: 9
· Color: Gray 60%
· Bold
Click OK to accept the label changes.
One downside to the automatic placement of labels is that you cannot manually modify individual labels. Label placement rules and settings apply to ALL labels within a label class with no exception.
A workaround to this limitation is to convert labels to annotations. But first, you will need to set the map’s final display scale (the reason will be made clear in subsequent steps).
Set the map’s scale to 1:520,000 (this will be the scale at which the final map will be presented/published).
![]()
Next, you will make this the data frame’s default scale.
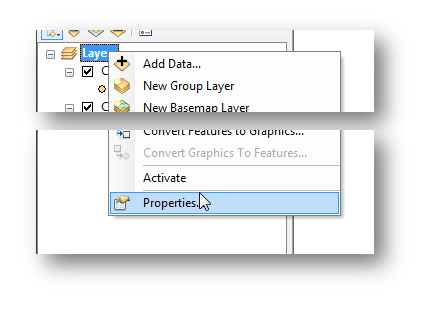
Open the data frame’s Properties window (right-click on Layers data frame).
In the General tab, set the Reference Scale to <Use Current Scale> (this sets the scale to 1:520,000). Alternatively, you could type the scale directly.
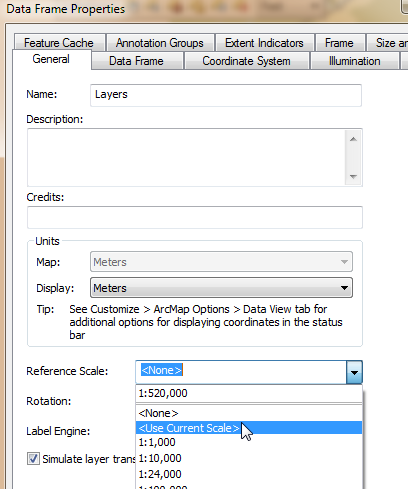
Click OK to accept the changes and close the data frame properties window.
You are now ready to convert the labels to annotations.
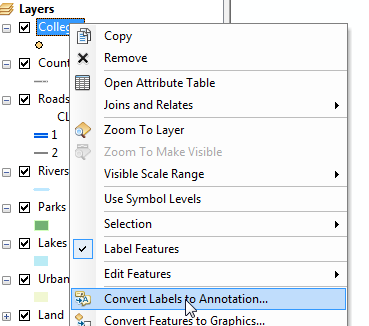
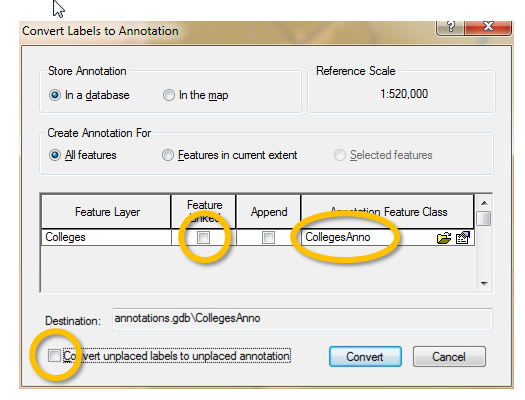
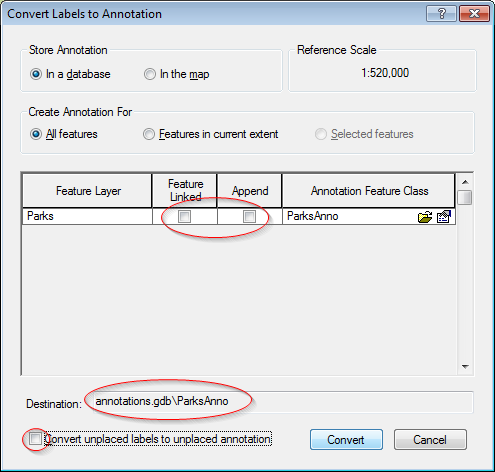
In the TOC, right-click on Colleges and select Convert Labels to Annotation.
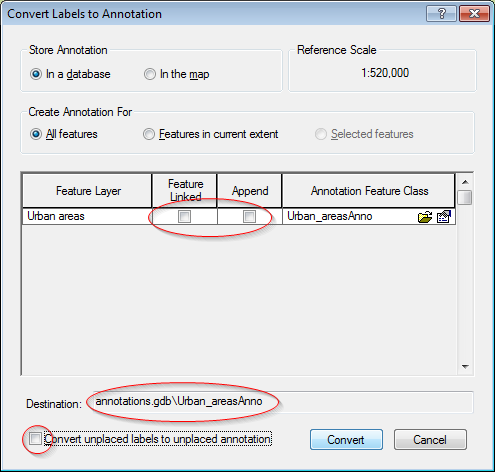
Uncheck Feature Linked.
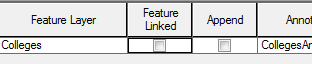
In the Convert Labels to Annotation window click on the little folder icon in the Annotation Feature Class column (this allows you to set the output location of the soon to-be created annotation).
Navigate to the Labels project folder.
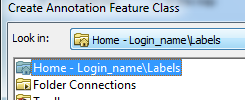
Create a new file Geodatabase under C:\Users\jdoe\Documents\Tutorials \Labels\ (or the directory path of your project folder) and name it annotations.gdb.
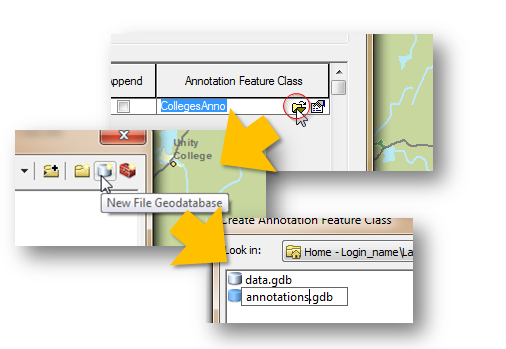
In the newly created annotations.gdb geodatabase, set the name of the new annotations to CollegesAnno.
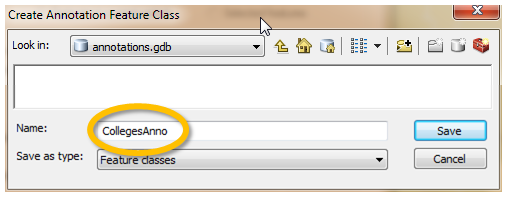
Click Save to close the window.
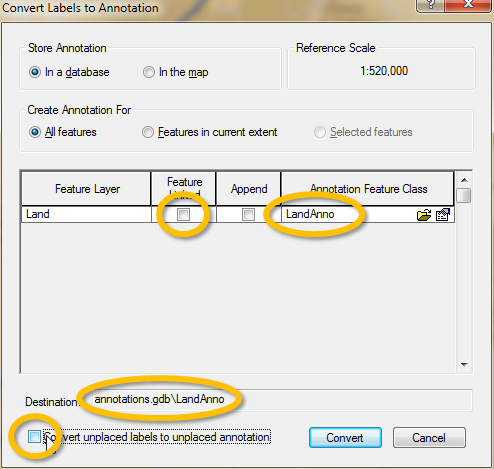
Make sure that the other settings appear as they do in the following graphic. Ensure that Convert unplaced labels to unplaced annotation is unchecked.
|
There are two kinds of annotation in the geodatabase—standard and feature-linked. Standard annotation is not formally associated with features in the geodatabase. An example of standard annotation is the text on a map for a mountain range. No specific feature represents the mountain range, but it is an area you want to mark. Feature-linked annotation is associated with a specific feature in another feature class in the geodatabase. The text in feature-linked annotation reflects the value of a field or fields from the feature to which it's linked. For example, the water transmission mains in a water network can be annotated with their names, which are stored in a field in the transmission mains feature class. |
Click Convert.
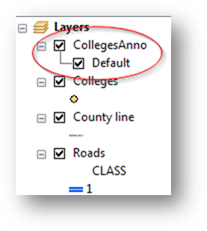
A new layer (CollegesAnno) should appear in the TOC
Geodatabase annotations are feature classes (much like vector and raster feature classes). And like feature classes, geodatabase annotations can be opened in other map documents (this facilitates transferring customized label placements to other MXD documents).
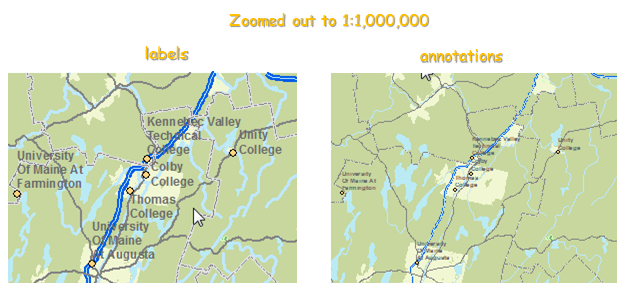
One difference between annotations and labels is that annotation scales are fixed. This means that as you zoom in, the text size gets bigger. Likewise, as you zoom out, text size gets smaller. That is why setting the map’s presentation scale before converting labels to annotations is critical!
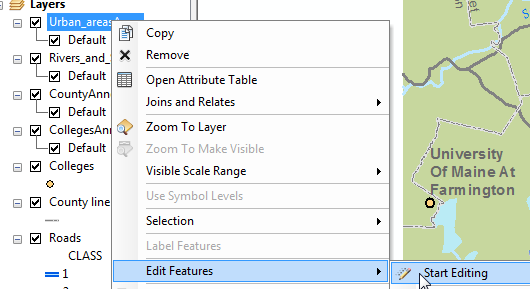
One advantage to working with annotations is that you can edit each label independently.
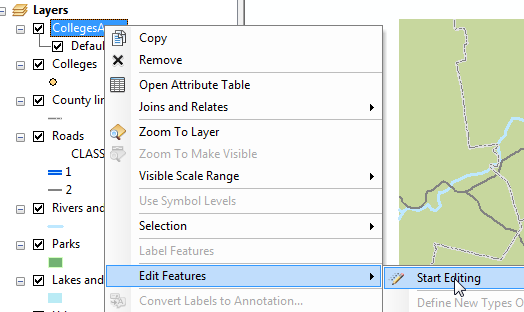
Right-click on the CollegesAnno layer and select Edit Features >> Start Editing.
This brings up the Create Features window pane used for editing vector features.
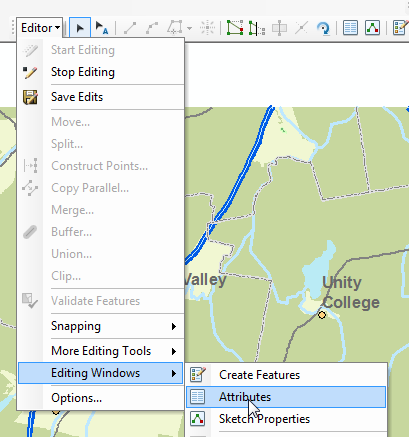
Annotations have a unique set of editing tools. You therefore need to open an Attributes editor window pane.
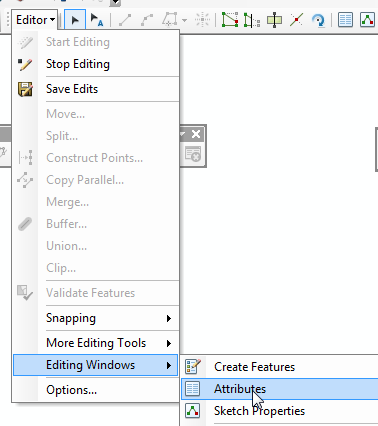
From the Editor pull-down menu in the Editor toolbar, select Editing Windows >> Attributes.
You are now ready to edit annotations. You will use the Edit Annotation Tool to select the annotation to be edited.
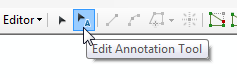
In the Editor toolbar, select the Edit Annotation Tool icon.
Using the Edit Annotation Tool pointer, select the University of Maine at Augusta annotation.
Move the text over to the left (just across from the interstate line feature).
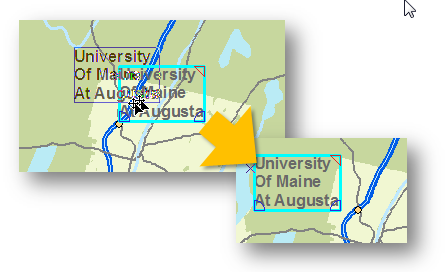
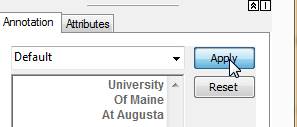
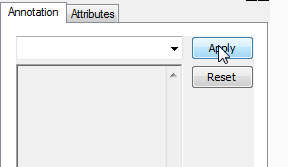
With the text still selected, set the text alignment to right justified (the text characteristics are set in the Attributes editor window pane on the right-hand side of the ArcMap application window)
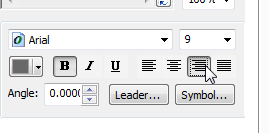
Click Apply.
Note that the change only applies to the University of Maine at Augusta annotation. The other annotations remain unchanged.
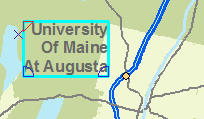
Clear the select annotation by clicking on the Clear Selected Features icon in the Tools toolbar.
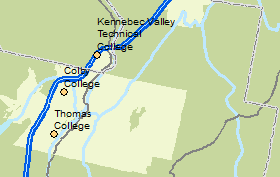
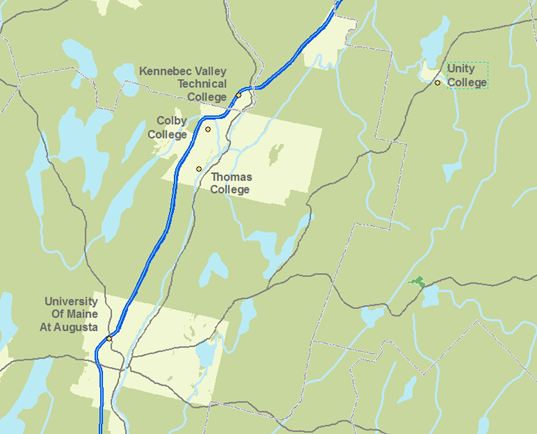
On your own, modify the other Colleges annotations as needed.
NOTE: if you find it difficult to precisely move an annotation because ArcMap’s ‘snapping to grid’ feature, press and hold the spacebar key as you move the annotation.
Examples of edits you might want to perform:
· Prevent annotations from crossing line features (particularly roads)
· Remove Beal College which may be too close to the map’s upper corner
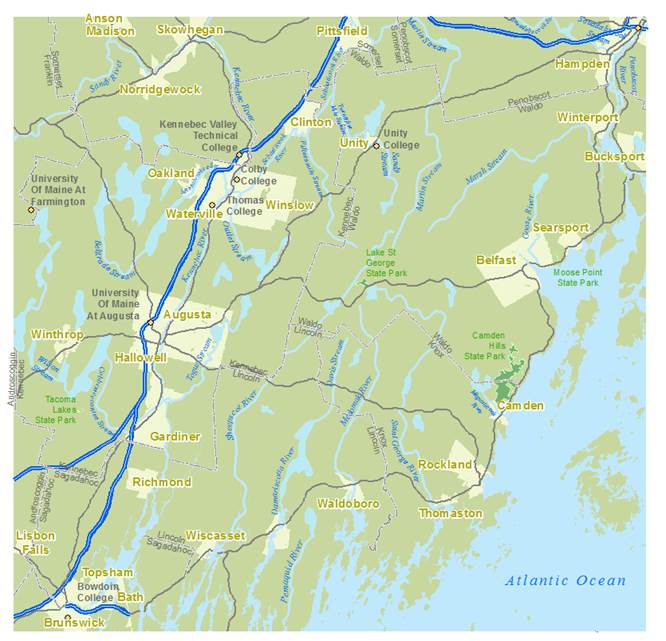
Use the following map as a template.
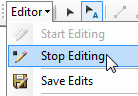
Save edits.
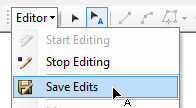
Stop the edit session.
There are many ways in which one can have ArcMap label features. In an earlier step, you right-clicked on a layer and selected Label Features. In the following step, you will add labels via the Labeling Manager window.
In the Labeling toolbar, click on the Label Manager icon.
Find the Land layer and place a check in its box (this enables labeling for this layer).
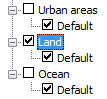
Note: the layer whose features will be labeled is called Land. It is different from the polyline feature County line which does not have county name attributes. In essence the latter is only used to display the line boundaries while the former is used to label the boundaries.
Select/Highlight the Default class just under the Land layer. Note: make sure that the Default class under the Land layer is selected/highlighted before proceeding.
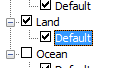
The layer’s labeling characteristics are displayed in the right pane.
Select COUNTY attribute as the label field and change the font color to Gray 60%.
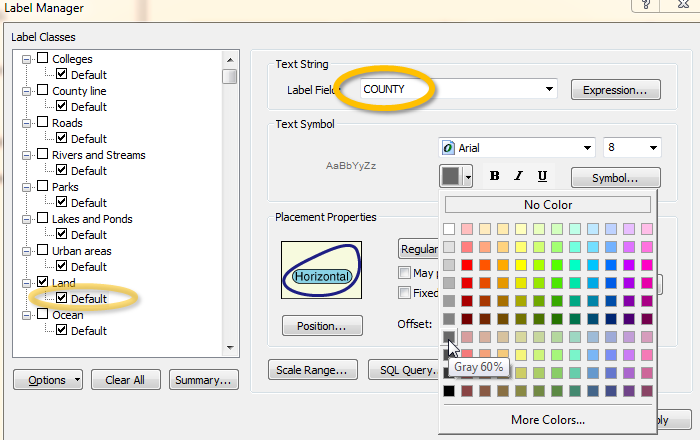
Next, you will change the placement of the labels. By default, polygon labels are placed at the center of the polygon (in our example at the center of the Land polygons). We will instead have ArcMap place the labels along the polygon boundaries.
Select Boundary Placement in the Placement Properties section.
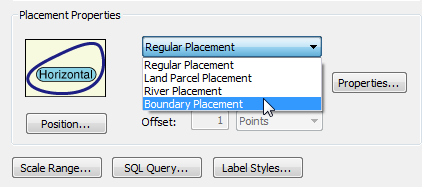
Click OK to have ArcMap draw the labels.
You might notice that the county labels are slow to display. This is because the software is computing the best label placements based on the county outline characteristics. This can be a nuisance for big maps and for lengthy workflows. As you will discover in the next step, annotations can be displayed at a much faster rate than labels.
We will now convert the county boundary labels to annotations following the method outlined in Step 4.
Following the procedures outlined in Step 4, convert Land labels to a new annotation feature class called LandAnno. You will place the annotation in the same geodatabase created in step 4 (CollegesAnno.gdb). Note that you are not given a chance to select the location for the new annotation until you unselect Feature Linked.
Click Convert.
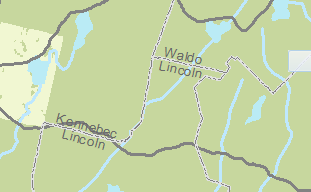
Once the labels are converted to annotations notice how much faster the county names are displayed.
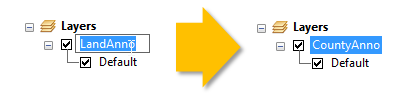
To minimize confusion, rename LandAnno to CountyAnno in the map’s TOC.
Unlike the College annotations, it seems that the county name annotations will not need major editing for now. We will now proceed to the rivers and streams annotations.
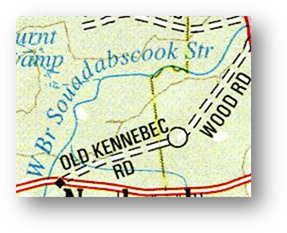
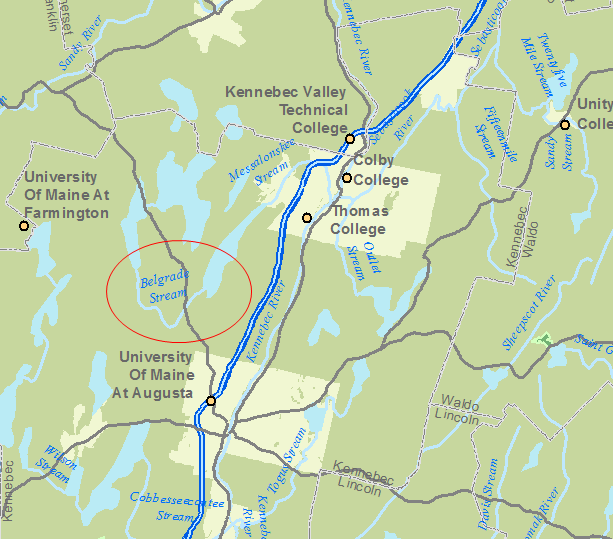
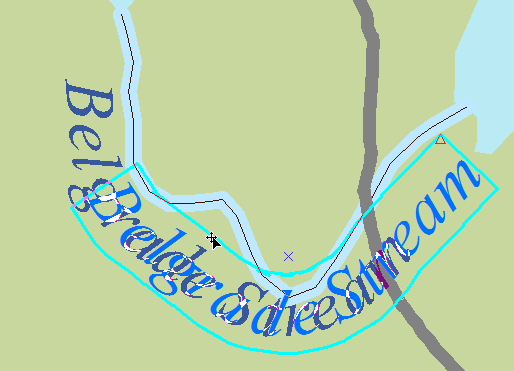
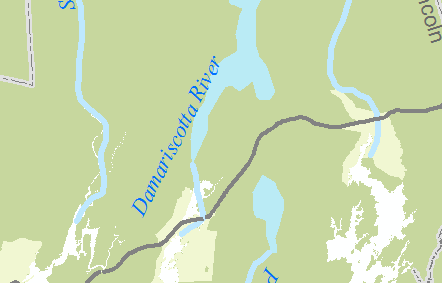
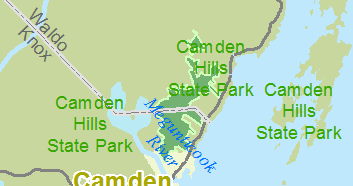
Labeling streams and rivers usually poses additional challenges as they often need to follow the outlines of meandering polyline features. See the following example from a DeLorme Gazeteer map:
Use the Label Manager window (outlined in Step 7) to add river and stream labels. Use the following graphic as reference.
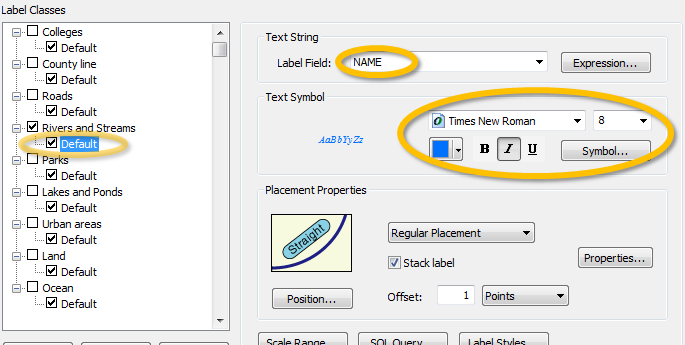
Click OK .
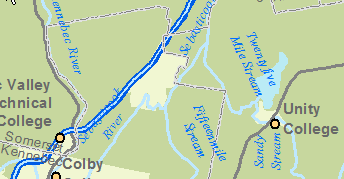
As you can see, the default label placements is not ideal.
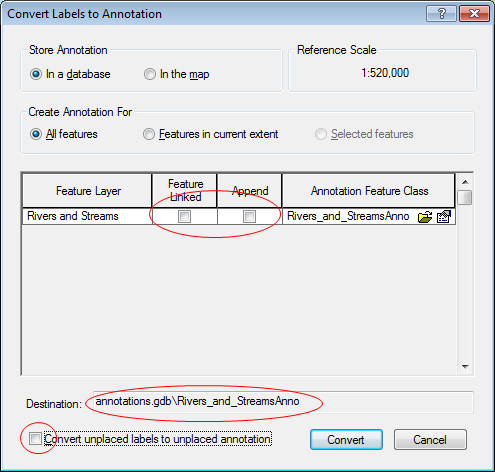
Following the procedures outlined in Step 4, convert labels to annotations. Save the new annotations in the same annotation geodatabase used earlier in the exercise (i.e. annotations.gdb). Name the new annotation feature class Rivers_and_StreamsAnno.
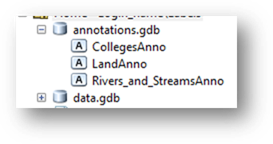
At this point, you should see a total of three annotation feature classes in the annotation geodatabase (you might need to expand the Catalog tab on the right-hand side of the ArcMap window and press the F5 key to refresh its content).
Next, you will force some of the rivers and streams annotations to follow the rivers and streams line features.
Right-click on the River_and_StreamsAnno layer and select Edit Features >> Start Editing.
Make sure that you display the Attributes editor pane.
In the Editor toolbar, select the Edit Annotation Tool icon.
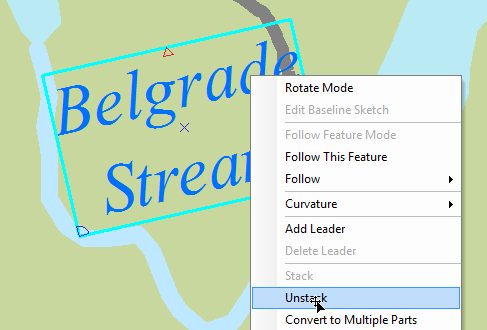
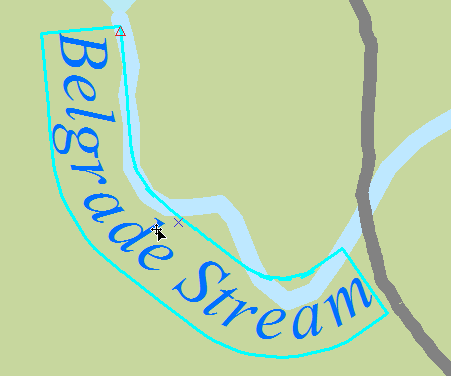
With the Edit Annotation Tool pointer select the Belgrade Stream annotation.
Zoom in on the Belgrade Stream annotation (recall that you can use the middle scroll wheel to zoom in and out).
Right-click on the feature and select unstack.
Next, you will instruct ArcMap to have the annotation follow the curvature of the river and stream feature.
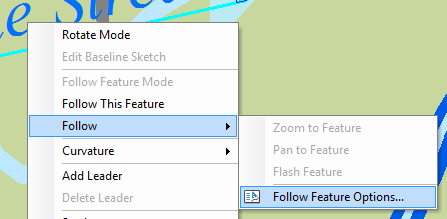
Right-click on the Belgrade Stream annotation and select Follow >> Follow Feature Options.
Choose Curved for Make annotation type and make sure that Use placement properties defined in annotation class is unchecked.
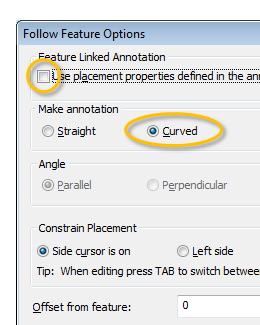
Click OK.
Make sure that the Belgrade Stream annotation is still selected.
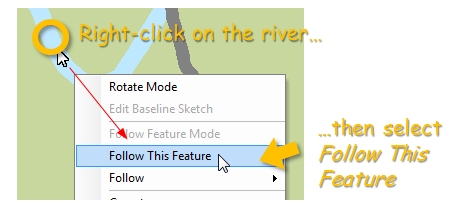
Right-click somewhere along the Belgrade Stream line feature (and not the annotation) and select Follow This Feature.
Now, move the annotation feature along the stream line feature as needed.
Note how the annotation curvature changes as you move the annotation up and down the stream.
The final annotation placement may look like this:
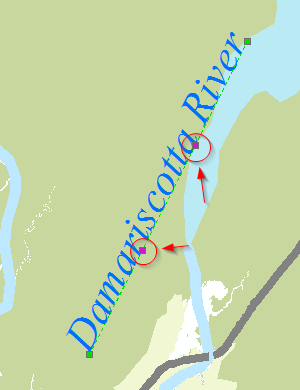
You can also manually adjust an annotation’s curvature. You will learn how with the Damariscotta river annotation.
Zoom in on Damariscotta river (southern end of the map).
If the label is stacked, right-click it and select Unstack.
Make sure that the Damariscotta river annotation is still selected.
Right-click the annotation and select Curvature >> Curved.
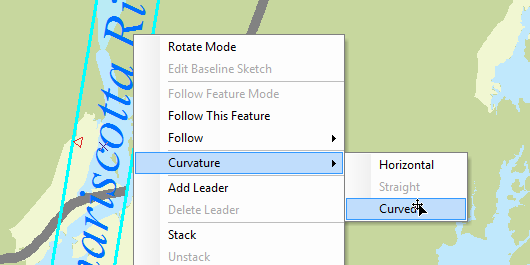
The annotation takes on a curved shape.
Right-click the annotation again and select Edit Baseline Sketch.
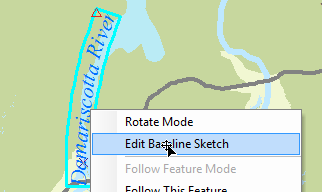
Note the spline vertices (you can add and remove vertices as needed). The vertices define the spline parameters.
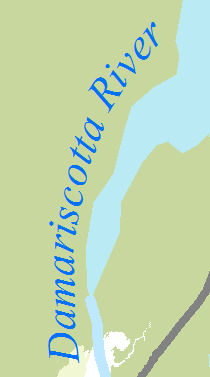
Select then move the vertices as needed to produce an annotation that follows the outline of the river.
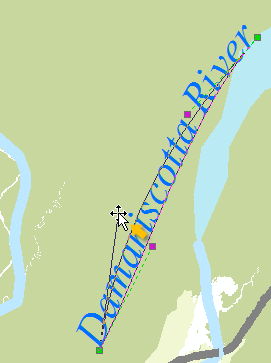
Attempt to replicate the following graphic.
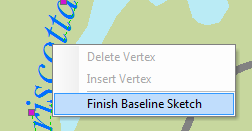
When you are done manipulating the spline vertices, right click the annotation and select Finish Baseline Sketch.
On your own, modify the remaining streams and rivers features as you see fit. Feel free to remove redundant annotations as needed.
Note: another annotation edit tool you might find useful is the rotate tool.
A few tips:
· Remove redundant annotations (i.e. duplicates) if needed.
· Use the Identify tool to ID rivers and streams if you are not sure which polyline feature the annotation belongs to.
· Resize fonts if needed (use this option sparingly). Do not use a font size less than 6.
· Remember that not all rivers and streams have to follow curvature.
Use the following map as a guide.
Save edits.
Stop the edit session.
Follow the procedure outlined in Step 7 to add Urban areas labels. Use the following graphic as reference.
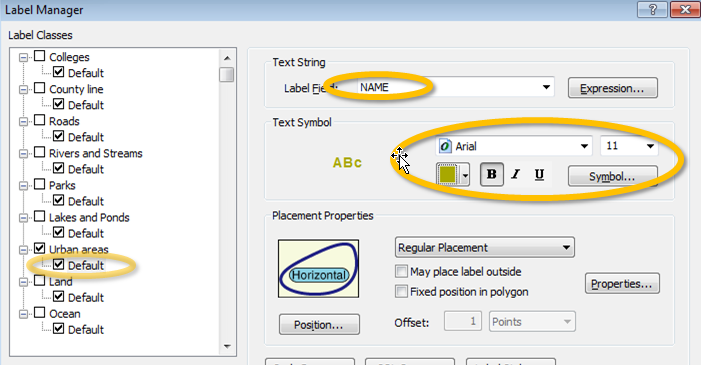
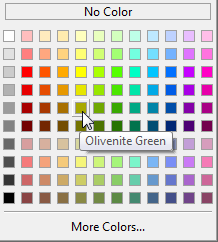
Use Olivenite Green for text color.
Click OK to close the Label Manager window.
You should see something like this:
Following the procedures outlined in Step 4, convert labels to annotations. Save the new annotations in the same annotation geodatabase used earlier in the exercise (i.e. annotations.gdb) . Name the new annotation feature class Urban_areasAnno.
After converting the labels to annotations start an Edit session.
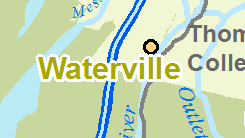
Zoom in on the Waterville annotation.
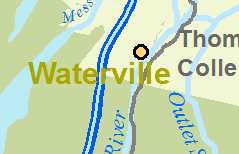
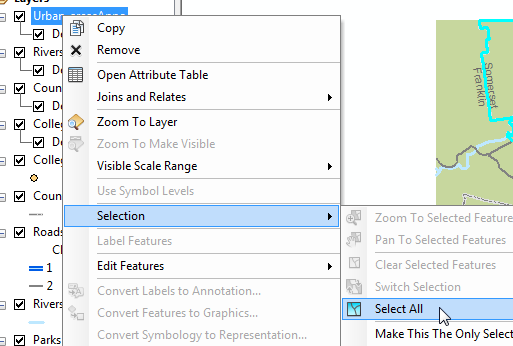
Note that the Waterville annotation crosses two road line features. This is not ideal. If you explore the remaining map extent, you come across other instances where annotations cross road features. One way to resolve this issue is to add a halo to all urban annotations.
Right-click the Urban annotation layer and select Selection >> Select All.
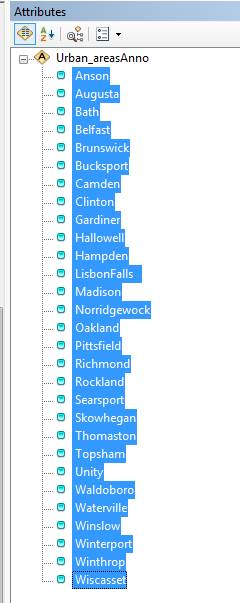
Make sure that you display the Attributes editor window pane.
In the Attributes editor window pane (on the right hand side of the ArcMap window), highlight all annotations (you can press and hold the shift key while you select the top and bottom name).
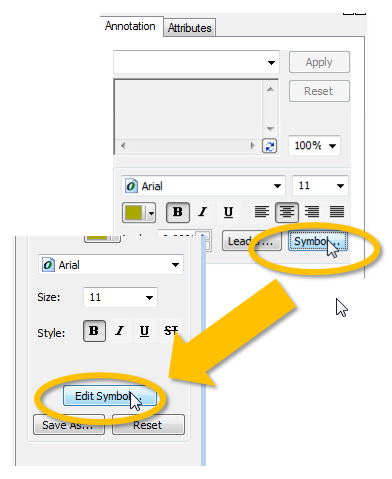
In the Annotation tab (below the list of selected names), click Symbol then Edit Symbol.
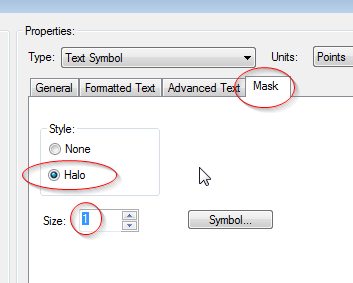
In the symbol editor click on the Mask tab.
Select Halo as the mask style and set the size to 1.
Click OK to close the symbol editor window.
Click OK to close the symbol selector window.
Click Apply.
The halo provides a nice buffer between the text and background features.
Unselect the annotations by clicking on the Clear Selected Features icon in the Tools toolbar.
On your own, make adjustments to the Urban annotation feature class as needed. Use the following map as a guide (note that you may need to remove redundant annotations).
Save the edits .
Stop the edit session.
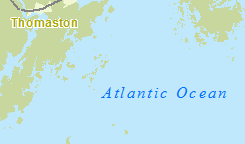
You don’t always need labels to create annotations. You can manually add annotations as needed to your map. In this step, you will add an annotation for the Atlantic Ocean.
From the Customize pull-down menu select Toolbars >> Draw.
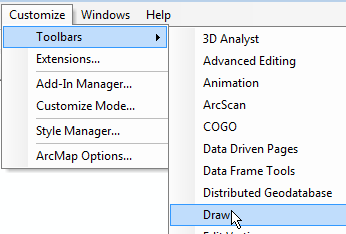
In the Draw toolbar, select the New Text icon.
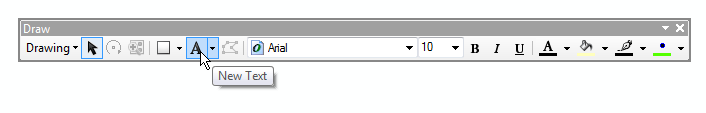
Set the font to Times New Roman, size 14, posture to italic and color to blue.

In the lower area of the map extent, add the Atlantic Ocean Annotation.
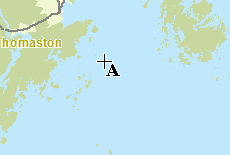
If needed, move the annotation so that it does not cross a land feature.
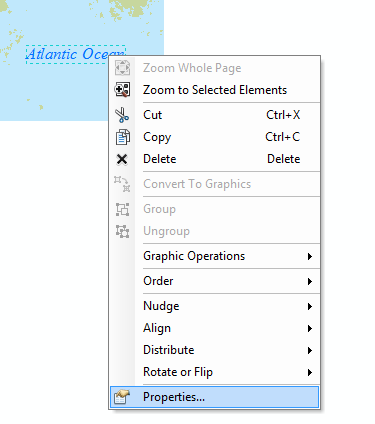
Right-click the annotation and select Properties.
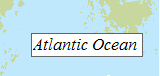
Next. you will span the annotation across a larger area.
Set the character spacing to 30.
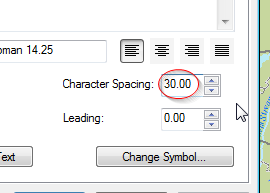
Click OK.
The text is now spread out over a wider area.
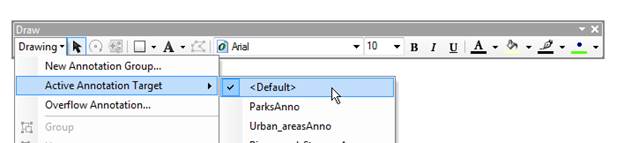
Note: the Atlantic Ocean annotation was not added to the annotation geodatabase created earlier in this exercise. By default, all manually created annotations are stored in the map document (i.e. the .mxd file). This can be verified by expanding Drawing and clicking on Active Annotation Target. The <Default> option refers to the built-in annotation group.
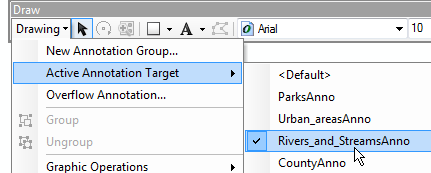
If you wanted to manually add an annotation to an existing annotation feature class (e.g. Rivers_and_StreamsAnno), you would select the target annotation feature class from the Active Annotation Target menu prior to adding the annotation to the map (these annotation classes can only be selected when an edit session is active).
Next, you will add Park annotations.
Follow the procedures outlined in Step 7 to add Parks labels. Use the following graphic as reference.
The labels should look something like this:
Following the procedures outlined in Step 4, convert labels to annotations. Save the new annotations in the same annotation geodatabase used earlier in the exercise. Name the new annotation feature class ParksAnno.
Start an edit session and modify the annotations as needed (e.g. right justify, remove duplicate annotations, etc…). Use the following graphic as a template.
Save the edits.
Stop the edit session.
In this step, you will add road symbols to the roads layer. However, unlike the labeling procedures adopted in previous steps, the roads labels will have two classes: an interstate class and a default class (for state and county roads). Defining separate classes allows you to customize labels for each.
Open Label Manager.
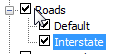
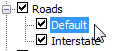
Highlight Roads in the left window pane. Type Interstate in the Enter class name field.
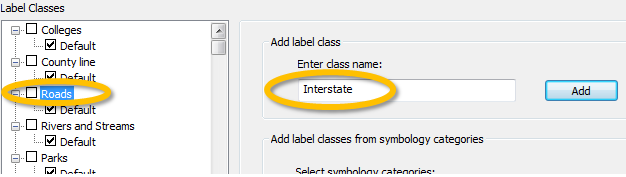
Click on the Add button (the one next to the class name Interstate).
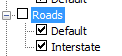
You now have the Default class (for state and county roads) and the Interstate class to work with.
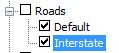
Select Interstate.
First, you need to instruct ArcMap to apply the Interstate class labeling scheme only to highways (i.e. those designated as Class 1 in the Roads layer). To do this, you will use a query expression which adopts the language of SQL (a popular database querying language). You can learn more about query expressions here.
Open the SQL Query window and type: “CLASS” = ‘1’
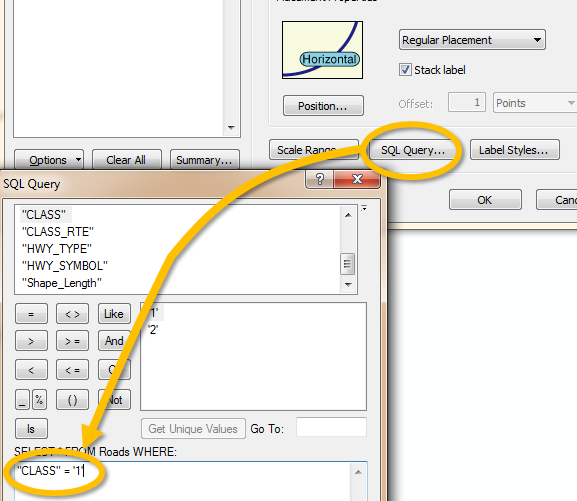
Click OK to close the SQL Query window.
Next, you will modify the Interstate label’s characteristics.
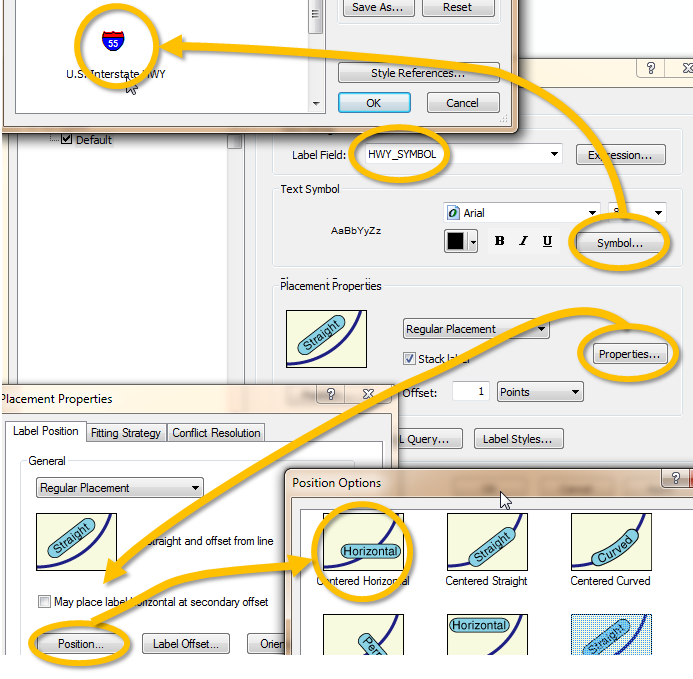
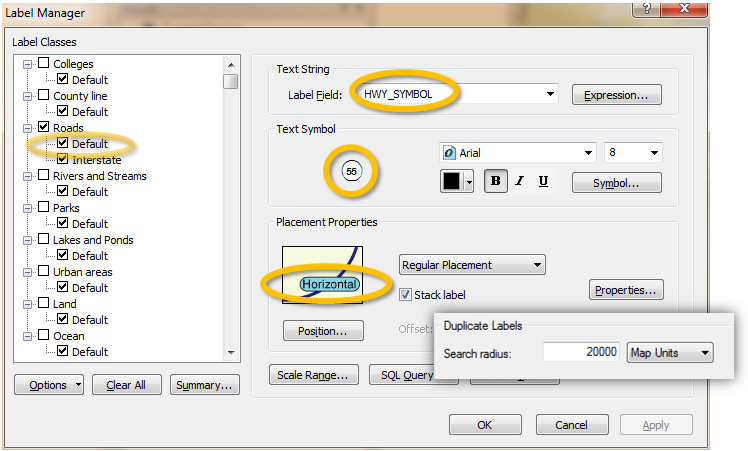
Modify the label characteristics for the Interstate class as follows:
· Select HWY_SYMBOL attribute for the label field
· Use the US highway symbol shield (accessed via the Symbol option)
· Position the label horizontally on the line features (defined under the Properties option)
You will also want to prevent the labels from appearing too often along the line feature. You will instruct ArcMap to place labels no closer than 50 km of one another.
Click on the Properties button in the Label Manager window.
Select the Label Density tab.
Check the Remove duplicates box and click on the Options… button.
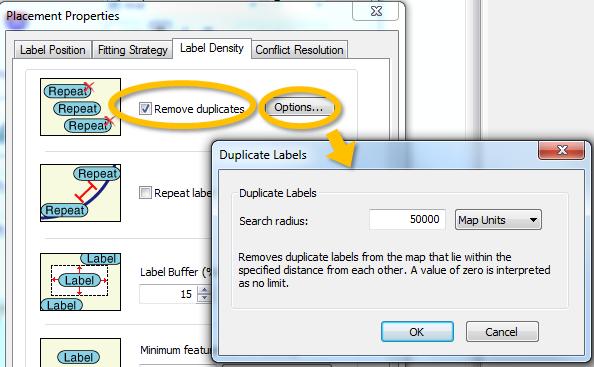
Set the search radius to 50000 map units (this is equivalent to 50,000 meters).
Click OK.
Click OK again to close the Placement Properties window.
If you haven’t done so already, check the box next to Roads in the left window pane.
The Label Manager window should look like this:
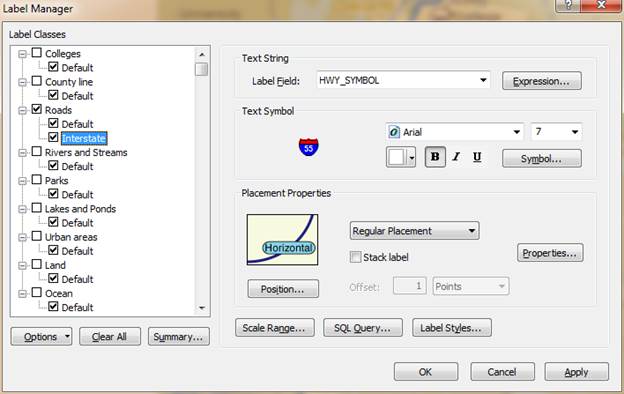
Click Apply to see the changes.
Next, you will define a symbol for the Default roads class.
In the left window pane, select (highlight) Default to display its label properties.
First, you need to instruct ArcMap to apply the Default class labeling scheme only to state and local roads (designated as Class 2 in the Roads layer).
Open the SQL Query window and type: "CLASS" = '2'
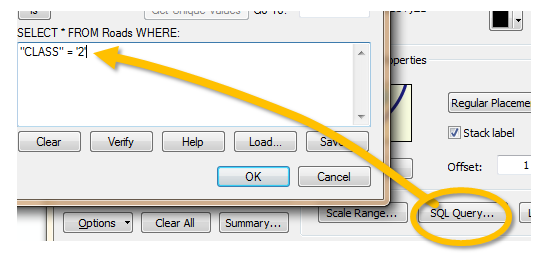
Click OK to close the SQL Query window.
Next, you will modify the label’s characteristics in the same way you modified the highway symbols.
Modify the label characteristics for the Default class as follows:
|
|
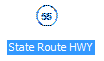
· Use HWY_SYMBOL attribute for the label field · Use the State Route HWY symbol (acessed via the Symbol button). · Position the label horizontally on the line features · Have labels placed no closer than 20 km (20,000 map units) |
Click OK.
Next, you will convert the road labels to annotations.
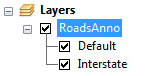
Following the procedures outlined in Step 4, convert the road labels to annotations. Save the new annotations in the same annotation geodatabase used earlier in the exercise. Name the new annotation feature class RoadsAnno.
Note that in the conversion process, the two label/annotation feature classes (Default and Interstate) are preserved.
Start the edit session and Edit the road annotations as needed.
Examples of changes that can be made is the relocation of the route 11 annotation (which may be masking the University of Maine at Augusta symbol) to the left of I-95. Note that this example my not apply to your map.
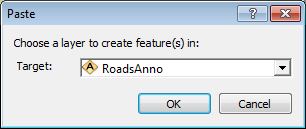
You may also want to add road symbols. Doing so is easy. Simply copy and paste an existing label. When pasting, you may be required to select the annotation feature class to which the pasted symbol will be added (i.e. RoadsAnno).
It sometimes helps to refer to a road atlas (Google maps, Gazeteer, etc..) to help fine tune the placement of road annotations.
Use the following template as a guide:
When done, done forget to save and stop your edit session.
On your own, make any final adjustments you think may be needed. Always remember to start and edit session and to open the attributes pane (from Editor >> Editing Windows in the Editor toolbar).
Examples of a few adjustments that may be needed:
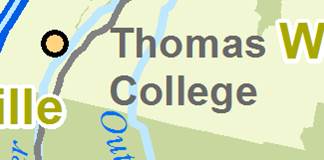
·
Assign a halo (whose color matches the Urban areas color)
to the Thomas College annotation, then move the annotation closer to
the point feature. NOTE: the urban color has an RGB values of 241,
247 and 210 respectively.
 to
to 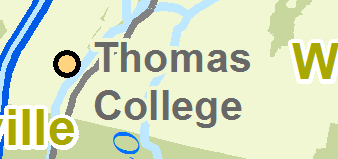
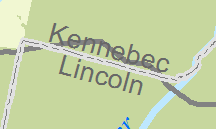
·
Use the same technique to discern ‘Kennebec’ county annotation from
the route 17 road line feature
 to
to 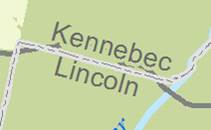
When done, save all edits and save your map document.
![]() Manuel Gimond, last modified on 7/10/2018
Manuel Gimond, last modified on 7/10/2018