Finding potential sites for a youth center
|
1. Create a folder called YouthCenter somewhere under your personal directory (e.g. C:\Users\jdoe\Documents\Tutorials\YouthCenter). 2. Download the data for this exercise then uncompress the Youth_Center.zip file to your newly created YouthCenter directory. |
NOTE: This exercise represents a fictitious scenario. It and its data are to be used for educational purposes only!!
The youth center task force has been created to find a suitable location for a new youth center. You are asked to analyze data and provide the city with a map that shows locations that meet the following criteria:
1. Lot must be vacant;
2. Lot must be within 50 meters of a high density youth population census block;
3. Lot must be between 0.5 and 2.0 acres in size.
Step 1: Start ArcMap and open the map document
Step 2: Identify census blocks with high youth population density
Step 3: Select vacant lots near dense youth population centers
Step 4: Select vacant lots by size
Open the Youth_Center.mxd map document.
You should see two layers in the table of contents, but only one layer (Waterville parcels) is displayed.
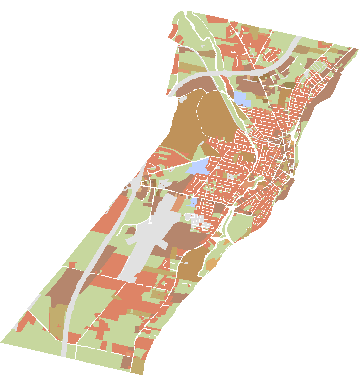
The youth center task force has asked you to locate areas where the youth population is the greatest (a census block is the smallest geographic unit for which the U.S. Census Bureau collects data).
Turn on the Waterville census layer.
![]()
By default, the Waterville census feature class is symbolized using a single symbol.
Open the Waterville census layer's attribute table by right-clicking on the layer and selecting Open Attribute Table.
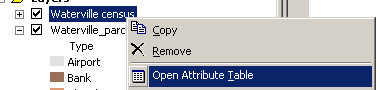
The census data divides the population by age and sex.
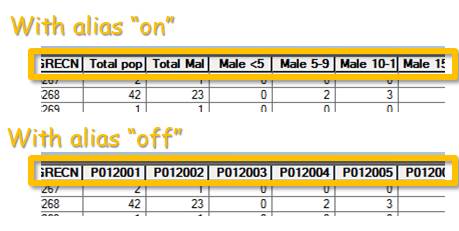
In the Waterville census attribute table, click on the Options button and make sure that Show Field Aliases is checked.
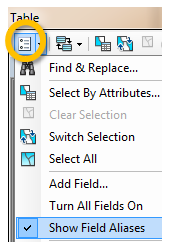
Assigning aliases to field names can be useful when working with shapefile data which restricts field name size and character content.
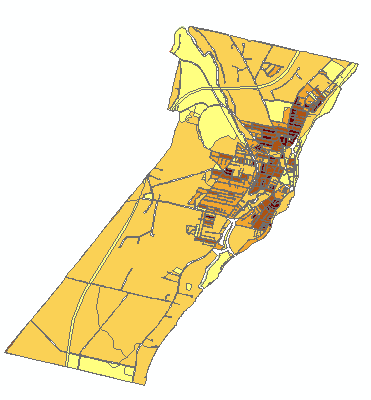
Next, you will symbolize the Waterville census layer using the Pop5_17 field. This attribute lists the number of people between the ages of 5 and 17 living in each census block.
Double-click on the Waterville census layer to bring up the Properties window. Select the Symbology tab. Select Quantities then Graduated colors from the Show box on the left. Use "Pop5_17" for the Value field.
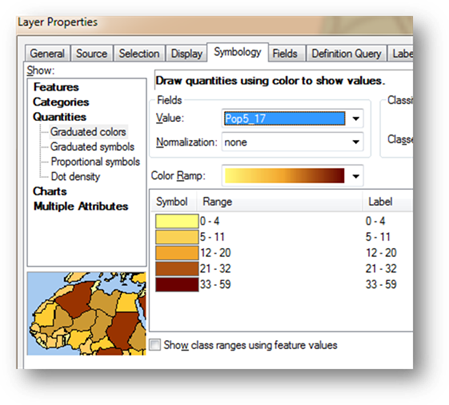
Click OK to close the Layer properties window.
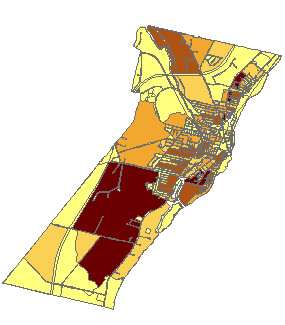
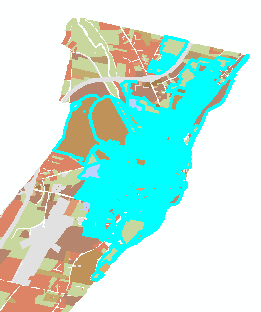
The darkest shaded areas are the ones where the greatest numbers of youth live. Each unit represents a census block.
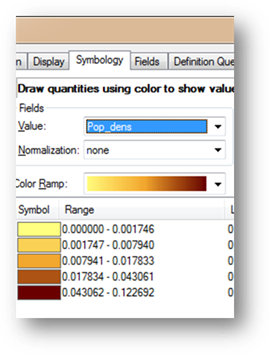
We would like to use the population data to identify areas of high youth population. However, the map we just created shows census units of different shapes and sizes. This distorts the true distribution of youth. We therefore need to normalize the data to census block surface area. The Waterville census layer has an attribute called Pop_dens which represents the youth population density (number of youth per unit area m2).
Open Waterville census layer’s Properties window.
In the symbology tab, set the Value field to Pop_dens.
You will change the classification scheme.
Click on the Classify button ![]() .
.
Select Quantile as the classification method.
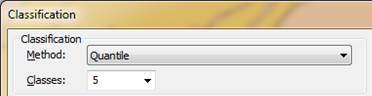
Click OK to close the Classification window.
Click OK to Close the Properties window.
Note how different the population density map looks compared to the population count map.
Next, you will create a definition query that will only display the census blocks meeting the city's criteria. The definition query does not modify the underlying shapefile, it only masks the data (as defined by the user) from the current ArcMap document.
Double-click the Waterville census layer to open its properties window and select the Definition Query tab.
Click on the Query Builder button.
![]()
In the Query Builder dialog box, type the following expression in the Expression box:
"Pop_dens" > 0.00016
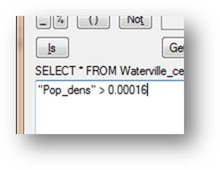
Click OK to close the Query Builder window.
Click OK to close the layer Properties window.
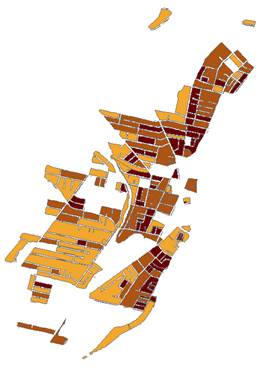
You now only see a subset of the Waterville census layer (you might need to uncheck the Waterville parcels layer to remove the background layer from the view). Only those polygons meeting the defined criteria are displayed. Though the underlying data file has not been changed (i.e. no polygons have been deleted from the original data file), the current map document session will treat this layer as though the “invisible” census blocks do not exist. This is a convenient alternative to creating a new data file from a census block subset.
Turn off Waterville census and turn on Waterville_parcels (if not already turned on) by unchecking and checking (respectively) the checkbox next to each layer in the TOC.
You will now select all polygons from the parcels layer that are within 50 meters of the census blocks having a youth population density greater than 0.00016 people per square meter.
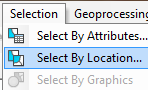
From the pull-down menu, select Selection >> Select By Location.
In the Select By Location dialog box, populate the fields and check the boxes as shown below.
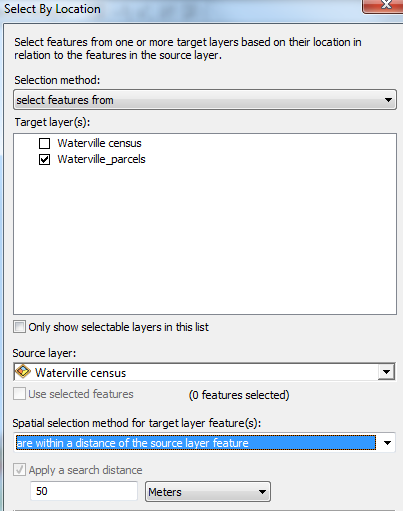
Click OK.
This last process selected all parcels (vacant or not) that are within 50 meters of the high youth population density census blocks.
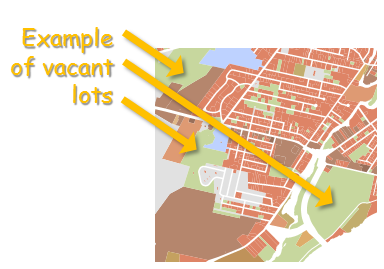
However, you are only interested in vacant lots. You will therefore select all Waterville parcels designated as vacant lots from the last selection. Vacant lands are symbolized as green polygons in the map.
Since the following selection processes build on top of existing selections, it is important that you do not unselect features using the unselect tool!
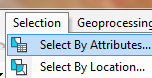
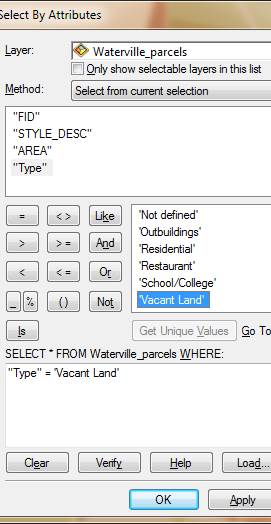
From the pull-down menu, select Selection >> Select By Attributes.
In the Select By Attributes dialog box make sure that "Select from current selection" is chosen as the Method type and the Waterville_parcels is the layer we are selecting from.
Select (highlight) the 'Type' field from the list of attributes then click on Get Unique Values to list all values associated with that attribute.
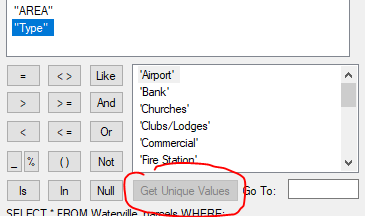
This action lists all unique values in the Type attribute. If you scroll down, you should see the value “Vacant Land”. Next, you will select all “Type” polygons equal to “Vacant Land”.
Type the following in the expression box:
"Type" = 'Vacant Land'
Click OK.
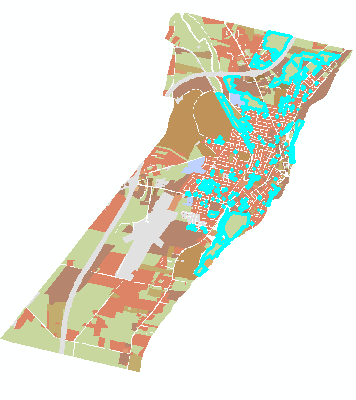
The number of selected features should have diminished. Only the vacant parcels within 50 meters of the nearest high youth census blocks are displayed.
The final criterion that will need to be met is the vacant lot size restriction.
Again, it’s important that you do not unselect the features you have selected so far before proceeding on to the next step.
The other criterion requires that land acquisition be greater than 0.5 acres but less than 2 acres.
The Vacant_lands attribute table has a column called AREA which contains area values for each parcel polygon in units of acres.
Open the "Select by Attributes" dialog (see step 3 if you forgot how to access this dialog) and setup the expression such that only features whose area is less than or equal to 2 acres and greater than or equal to 0.5 acres are selected. Don’t forget to select the method “Select from current selection”.
"AREA" >= 0.5 AND "AREA" <= 2
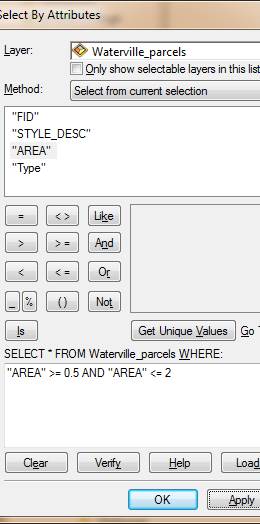
Click OK.
Open the Waterville_parcels’ attribute table.
At the bottom of the Table window, click on the show selected records button. This will show only the selected parcels.
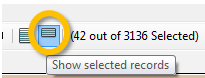
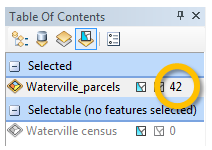
The number of selected features is displayed at the bottom of the table. You should find 42 vacant parcels that meet all criteria.
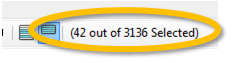
You can also see the number of selected features from the TOC pane.
Near the top of the TOC, click on the “List By Selection” button.
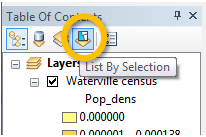
This TOC option displays the layers in your map along with the number of selected features.
The final step will be to export the selected vacant lots to a new layer.
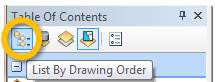
In the TOC, return to the default TOC view by clicking on the “List by drawing order” button.
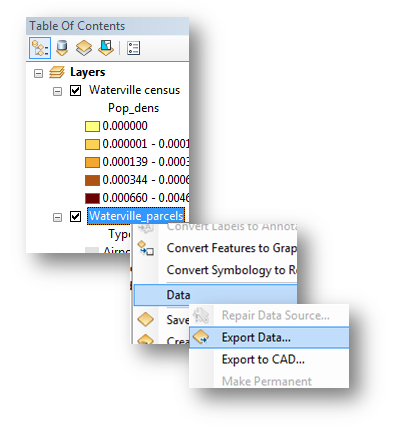
Right-click on the Waterville_parcels and select Data >> Export Data.
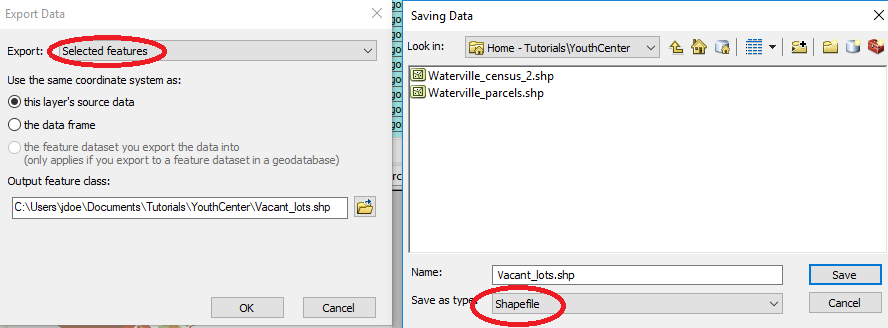
Name the output shapefile Vacant_lots.shp and place it in your working folder. Make sure that you are exporting “Selected features” and that the output file is a shapefile.
Click OK.
If asked if the exported data should be added to your map, select Yes.
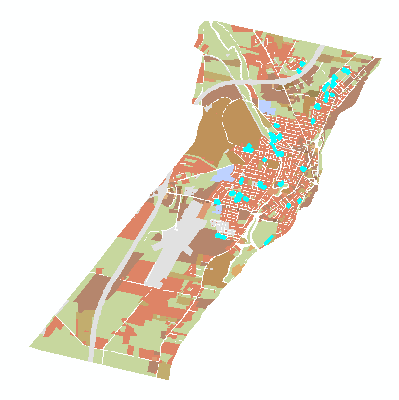
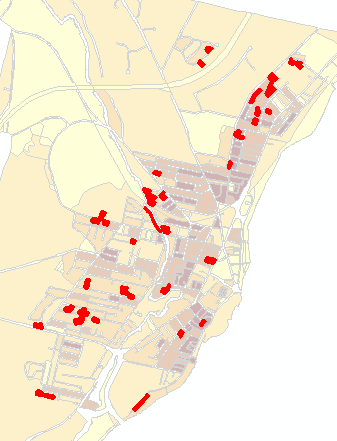
Finally, change the Vacant_lots layer symbology to a saturated red. Since the parcels are small and do not stick out in the map, you may want to change the transparency level of the Waterville census layer to 70% by opening that layer's Properties dialog box, selecting the Display tab and setting the Transparent value to 70%. If you want to display all census polygons, don’t forget to remove the Waterville census’ definition query in its Properties window.
In step 2, you used a definition query to isolate all census blocks that had a youth population greater than 0.00016 people/m2. Tackle this criterion using the Select by Attribute to select the census blocks meeting the 0.00016 people/m2 criteria, then complete the other steps outlined in 3 and 4. You should end up with the same results.
![]() Manuel Gimond, last modified on 7/16/2018
Manuel Gimond, last modified on 7/16/2018