eda_dens generates overlapping density distributions for
two variables.
Usage
eda_dens(
  x,
  y,
  fac = NULL,
  p = 1L,
  tukey = FALSE,
  base = exp(1),
  fx = NULL,
  fy = NULL,
  grey = 0.6,
  col = "red",
  show.par = TRUE,
  alpha = 0.4,
  xlab = NULL,
  ylab = NULL,
  xaxis = NULL,
  switch = FALSE,
  legend = TRUE,
  kernel = "gaussian",
  ...
)
Arguments
- x
A numeric vector for the first variable, or a dataframe when providing data in long format.
- y
A numeric vector for the second variable. When
xis a dataframe,yshould be the unquoted name of the column containing the continuous numeric values.- fac
When
xis a dataframe,facshould be the unquoted name of the column containing the two-level categorical (grouping) variable.- p
Power transformation to apply to both sets of values.
- tukey
Boolean determining if a Tukey transformation should be adopted (FALSE adopts a Box-Cox transformation).
- base
Base used with the log() function if
p = 0.- fx
Formula to apply to x variable. This is computed after any transformation is applied to the x variable.
- fy
Formula to apply to y variable. This is computed after any transformation is applied to the y variable.
- grey
Grey level to apply to plot elements (0 to 1 with 1 = black).
- col
Fill color for second density distribution.
- show.par
Boolean determining if parameters such as power transformation or formula should be displayed.
- alpha
Fill transparency (0 = transparent, 1 = opaque). Only applicable if
rgb()is not used to define fill colors.- xlab
X variable label. Ignored if
xis a dataframe. This is not the x-axis label!- ylab
Y variable label. Ignored if
xis a dataframe. This is not the y-axis label!- xaxis
Label for x-axis. Defaults to the name of the
faccolumn when using a dataframe, and to"Value"when using vectors.- switch
Boolean determining if the axes should be swapped. Only applies to dataframe input. Ignored if vectors are passed to the function.
- legend
Boolean determining if a legend should be added to the plot.
- kernel
The kernel to be used. Can be one of the kernels supported by
stats::density("gaussian", "epanechnikov", "rectangular", "triangular", "biweight", "cosine", "optcosine"), or"sliding"for a custom sliding-window rectangular kernel estimator.- ...
Arguments passed to the
stats::density()function (e.g.,bw,n). These are also used by the"sliding"kernel.
Details
This function will generate overlapping density plots with the first variable assigned a grey color and the second variable assigned the default red color.
The "sliding" kernel implements a simple sliding window estimator with a
rectangular kernel. The density at a point x0 is computed as the
proportion of data points falling within the window divided by the
bandwidth and sample size product (# points in bin / (bandwidth * sample size).
Examples
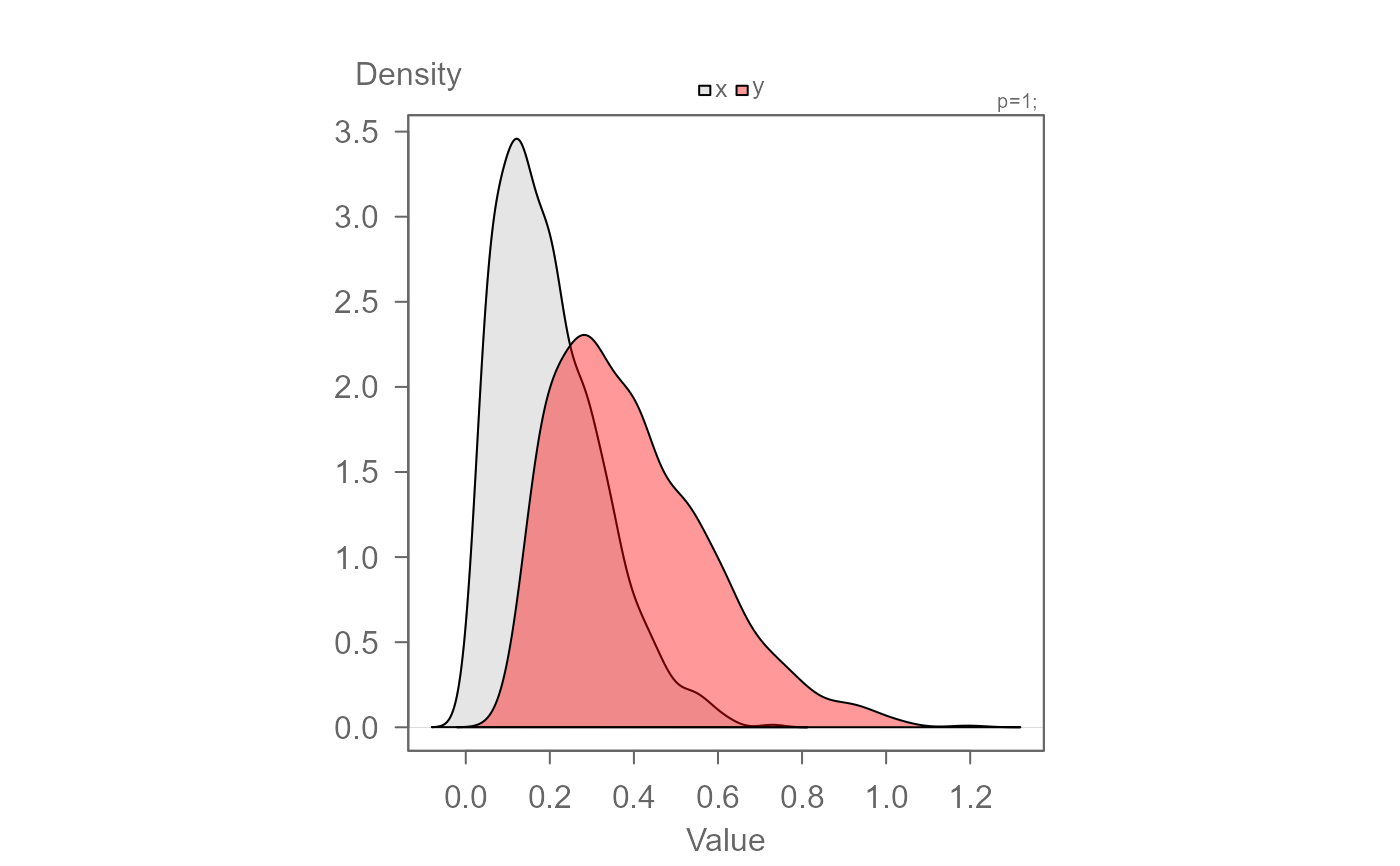
# Passing data as two separate vector objects
set.seed(207)
x <- rbeta(1000,2,8)
y <- x * 1.5 + 0.1
eda_dens(x, y)
 # Passing data as a dataframe
dat <- data.frame(val = c(x, y),
grp = c(rep("x", length(x)), rep("y", length(y))))
eda_dens(dat, val, grp)
# Passing data as a dataframe
dat <- data.frame(val = c(x, y),
grp = c(rep("x", length(x)), rep("y", length(y))))
eda_dens(dat, val, grp)
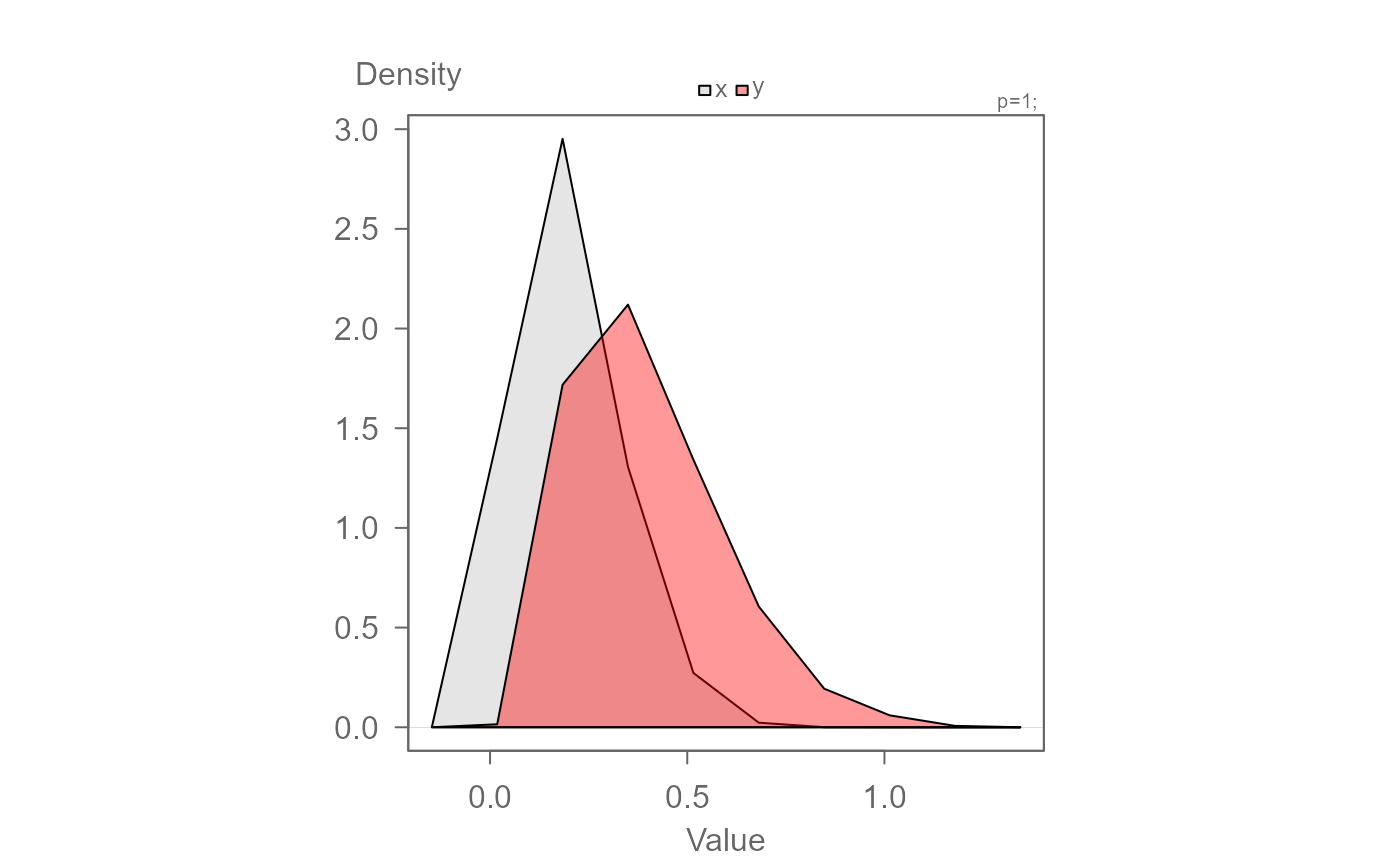
 # Defining density paramters that are passed to stats::density()
eda_dens(x,y, bw = 0.05, kernel="cosine", n = 10)
# Defining density paramters that are passed to stats::density()
eda_dens(x,y, bw = 0.05, kernel="cosine", n = 10)
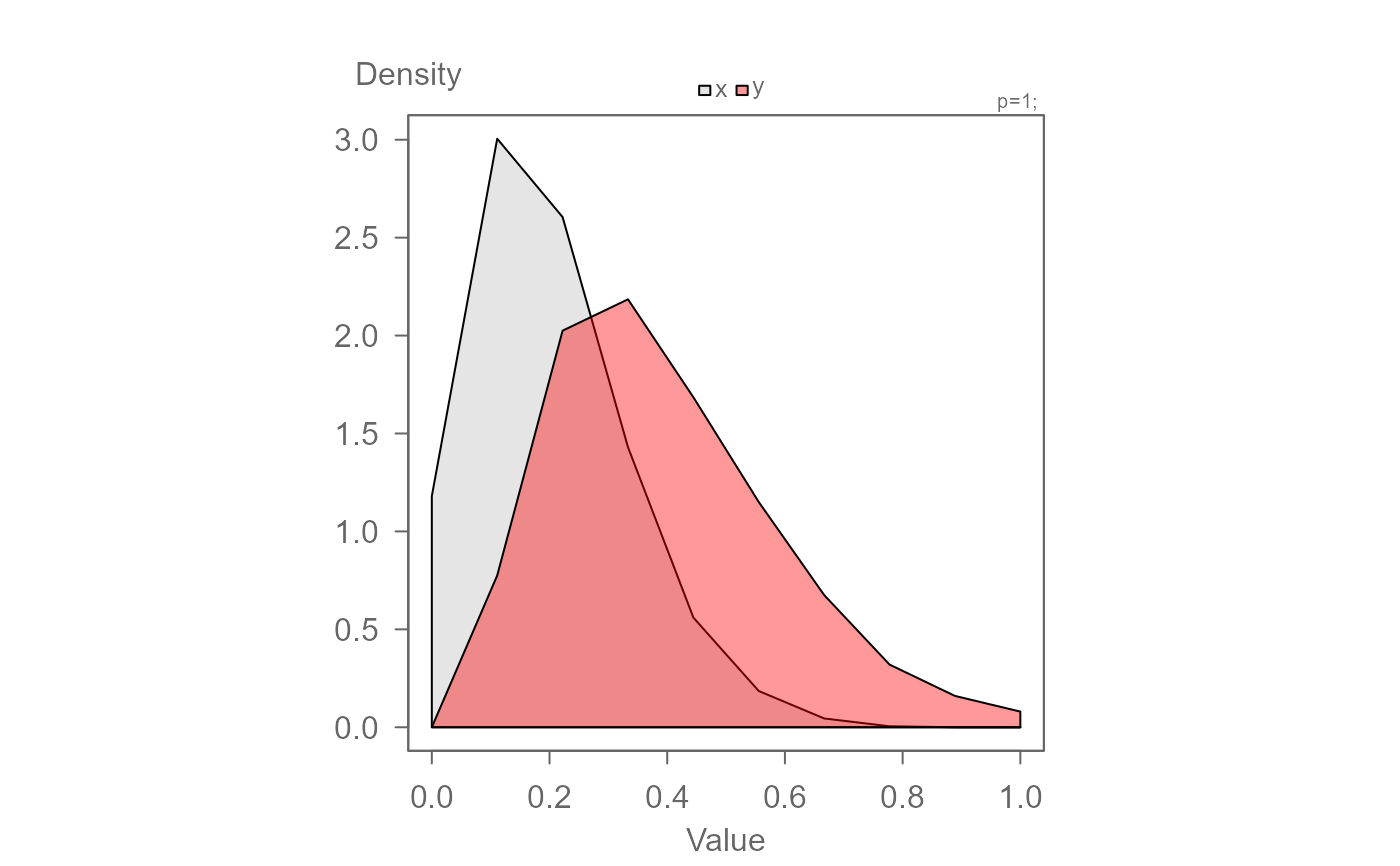
 # Adopting the custom sliding rectangler kernel
eda_dens(x, y, from = 0, to=1, kernel = "sliding", bw=0.2, n = 10)
# Adopting the custom sliding rectangler kernel
eda_dens(x, y, from = 0, to=1, kernel = "sliding", bw=0.2, n = 10)