eda_jitter creates a jitter plot from a continuous
variable conditioned on a categorical variable.
Usage
eda_jitter(
  dat,
  x,
  fac = NULL,
  jitter = 0.05,
  p = 1,
  tukey = FALSE,
  base = exp(1),
  horiz = FALSE,
  stat = mean,
  show.stat = TRUE,
  stat.type = "p",
  stat.col = "firebrick",
  stat.fill = "bisque",
  stat.size = 2,
  stat.pch = 21,
  stat.pad = 1,
  xlab = NULL,
  ylab = NULL,
  grey = 0.6,
  pch = 21,
  p.col = "grey50",
  p.fill = "grey80",
  size = 0.8,
  alpha = 0.8,
  reorder = TRUE,
  show.par = TRUE,
  ylim = NULL
)
Arguments
- dat
Dataframe.
- x
Continuous variable.
- fac
Categorical variable.
- jitter
Jittering parameter. A fraction of the group width (
0to1).- p
Power transformation to apply to variable
- tukey
Boolean determining if a Tukey transformation should be adopted (
FALSEadopts a Box-Cox transformation).- base
Base used with the log() function if
p = 0.- horiz
Plot horizontally (
TRUE) or vertically (FALSE).- stat
Choice of summary statistic to use when fitting a central value to the data.
statcan be eithermeanormedian. DO NOT wrap stat parameter in quotes.- show.stat
Boolean determining if a summary statistic should be added to jitter plot.
- stat.type
Symbol to use to display statistical summary. Can be either a point,
"p", or a line,"l".- stat.col
Symbol color to use to display statistical summary. If
stat.typeis a point, then the color will be passed to its outline if the point symbol type,stat.pch, is 21 through 25.- stat.fill
Fill color to use for the point statistical summary if the point symbol type,
stat.pch, is 21 through 25. Ignored ifstat.type = "l".- stat.size
Size of point statistical summary if
stat.type = "p", or width of line ifstat.type = "l".- stat.pch
Point statistical summary type (1 through 25). Ignored if
stat.type = "l".- stat.pad
Fraction to add to the length of the line statistical summary. Ignored if
stat.type = "p".- xlab
X label for output plot
- ylab
Y label for output plot
- grey
Grey level to apply to plot elements (0 to 1 with 1 = black)
- pch
Point symbol type
- p.col
Color for point symbol
- p.fill
Point fill color passed to
bg(Only used forpchranging from 21-25).- size
Point size (0-1).
- alpha
Point transparency (0 = transparent, 1 = opaque). Only applicable if
rgb()is not used to define point colors.- reorder
Boolean determining if factors have to be reordered based on
stat.- show.par
Boolean determining if power transformation should be displayed in the plot.
- ylim
Define custom y axis limits (or x limits if
horiz=TRUE).
Details
Function generates jitter plot from a univariate dataset. If no categorical
variable is passed to the function, a single jitter plot is created from the
data.
By default, the plots are ordered based on the statistic, stat, used to generate
the central value.
Examples
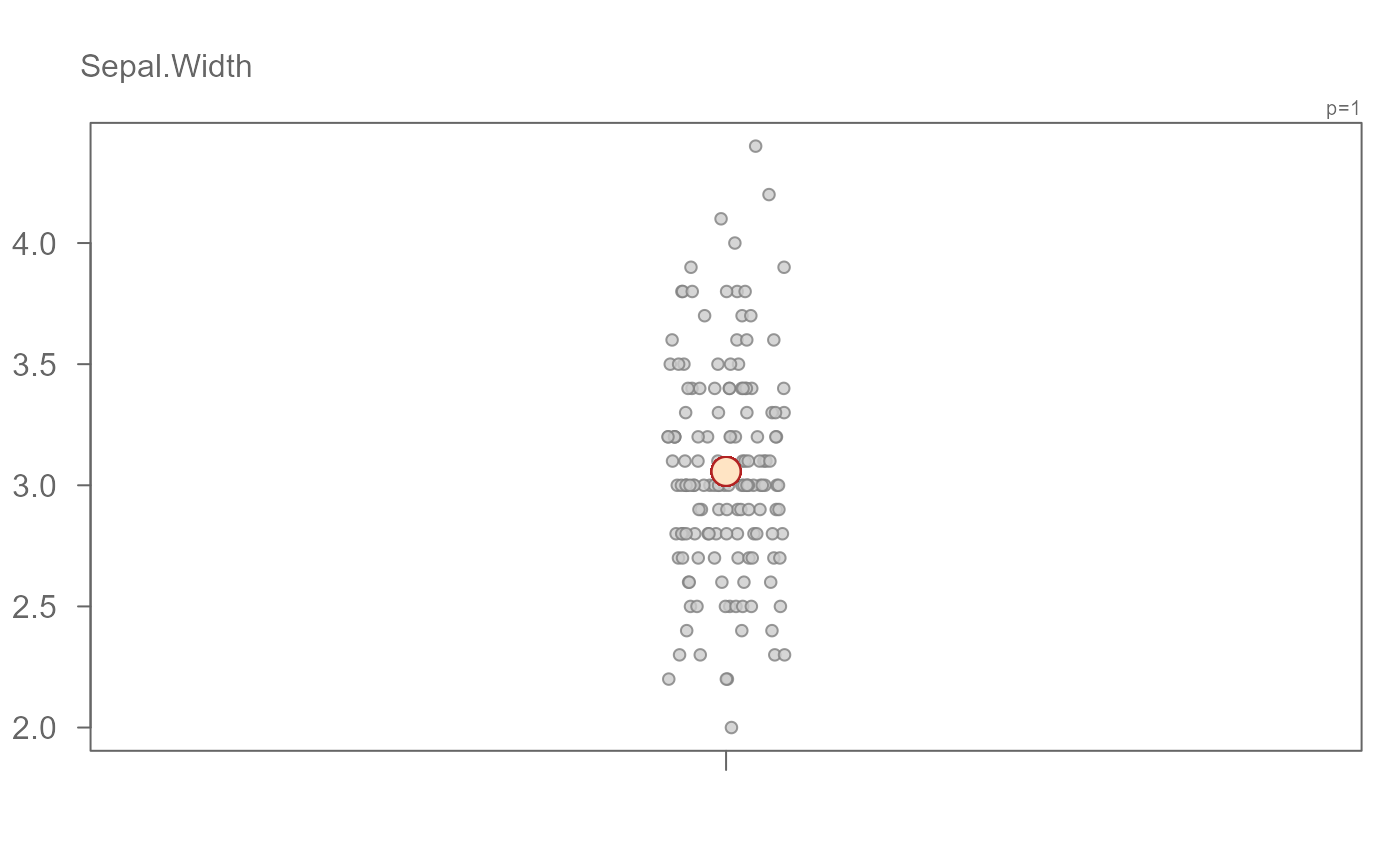
# A basic jitter plot for a single variable where the mean is automatically
# fitted to the data
eda_jitter(iris, Sepal.Width)


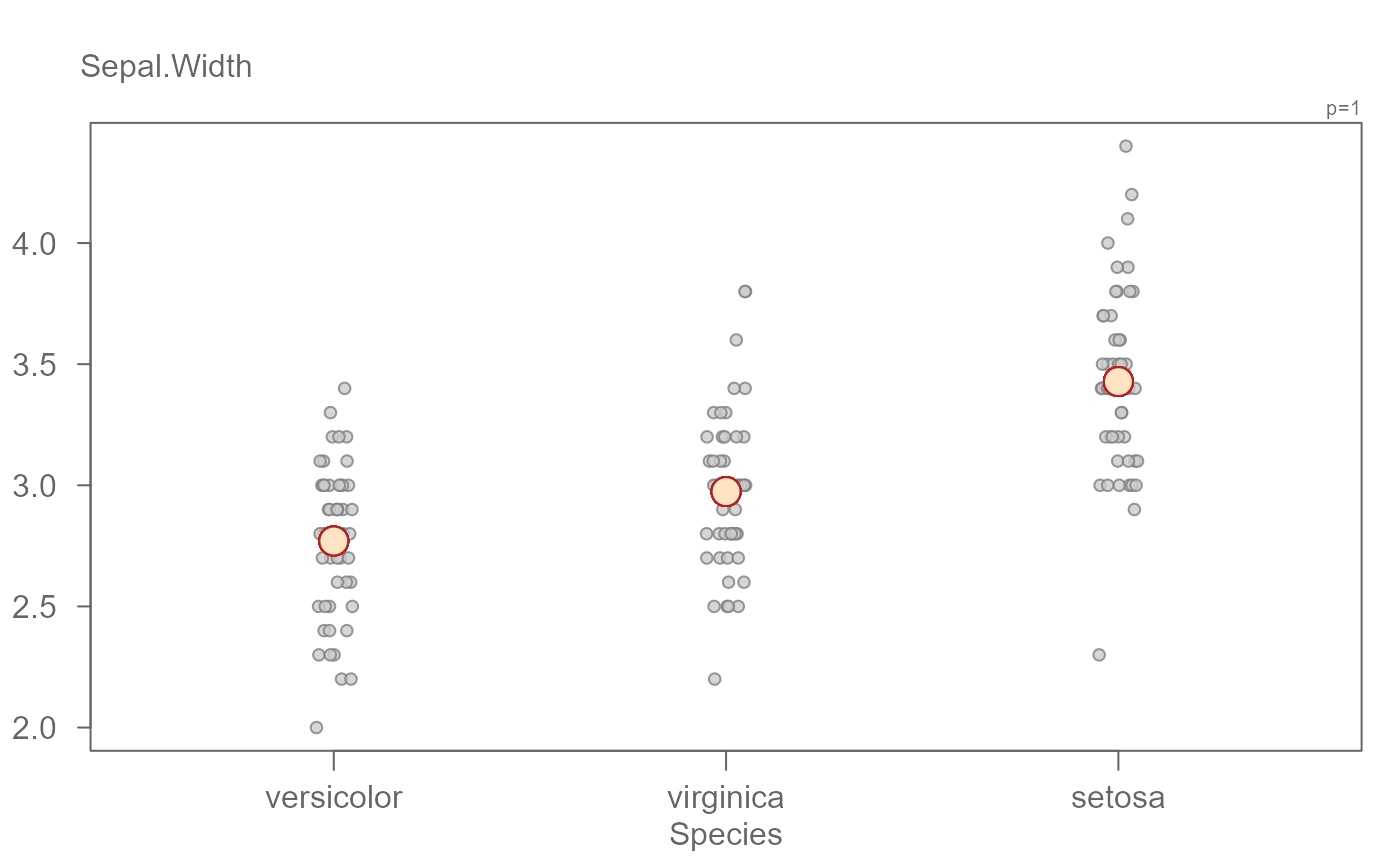
# A basic jitter plot conditioned on a categorical variable
eda_jitter(iris, Sepal.Width, Species)


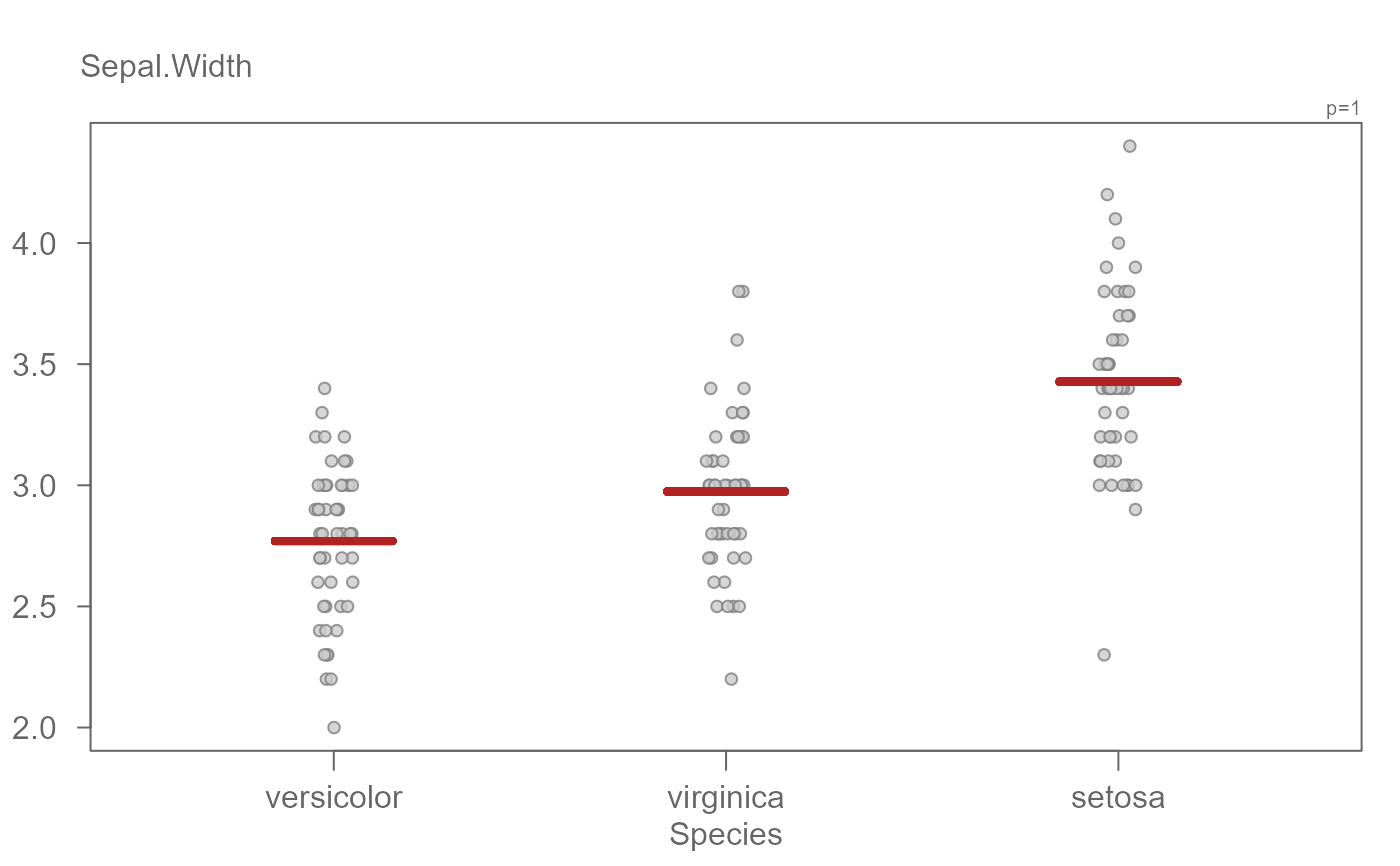
# Use line instead of point for summary statistic
eda_jitter(iris, Sepal.Width, Species, stat.type = "l")


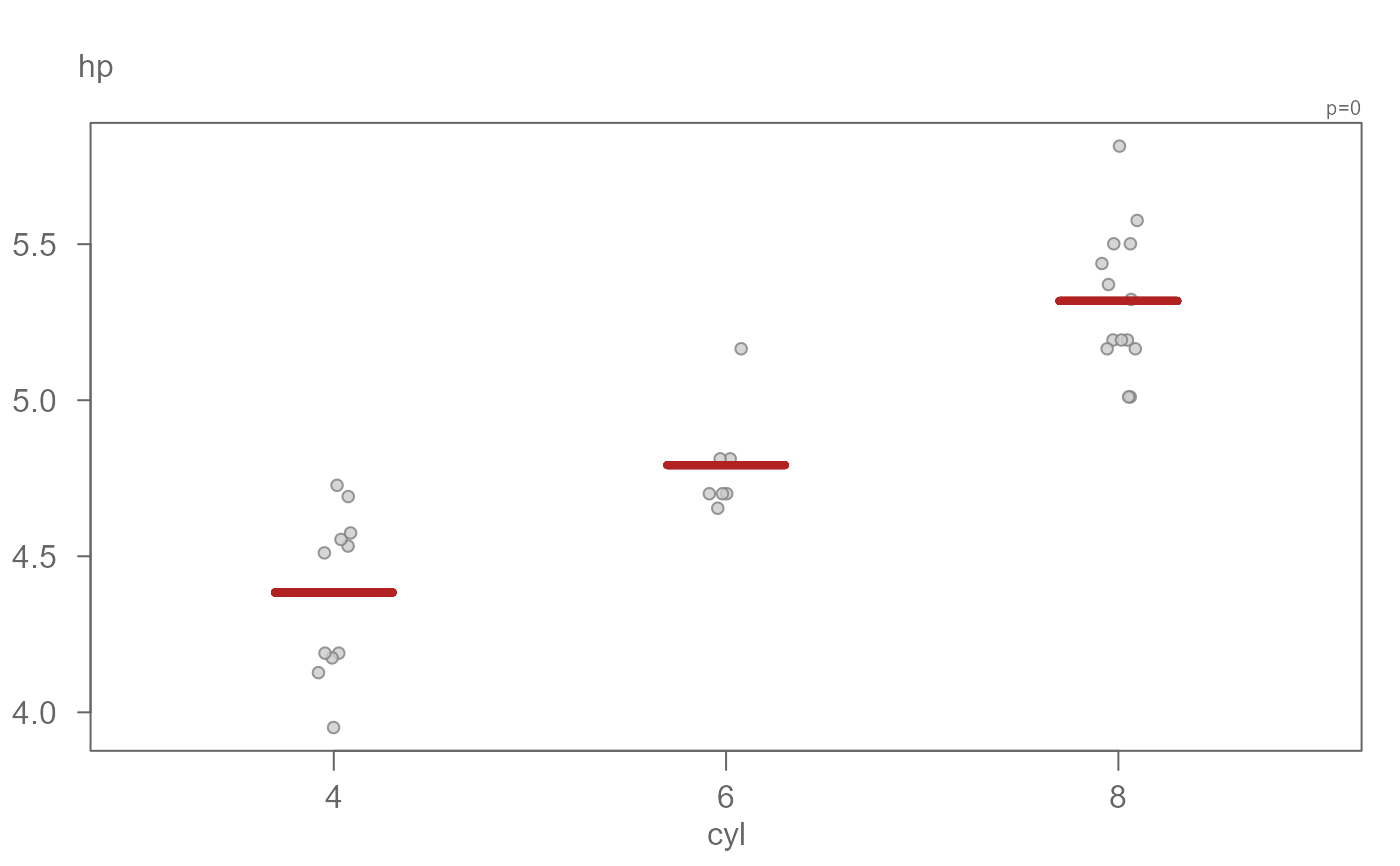
# You can apply a transformation to the data. The summary statistic will be
# computed after the data are transformed.
eda_jitter(mtcars, hp, cyl, stat.type = "l", p = 0)
