eda_sym Generates a symmetry QQ plot.
Usage
eda_sym(
  x,
  p = 1L,
  tukey = FALSE,
  base = exp(1),
  q.type = 5,
  show.par = TRUE,
  grey = 0.6,
  pch = 21,
  p.col = "grey50",
  p.fill = "grey80",
  size = 0.8,
  alpha = 0.8,
  inner = 0.75,
  q = TRUE,
  qcol = rgb(0, 0, 0, 0.05),
  tails = FALSE,
  tail.pch = 21,
  tail.p.col = "grey70",
  tail.p.fill = NULL,
  xlab = NULL,
  ylab = NULL,
  title = NULL,
  t.size = 1.2,
  plot = TRUE,
  ...
)
Arguments
- x
Vector of sample
- p
Power transformation to apply to
x.- tukey
Boolean determining if a Tukey transformation should be adopted (
FALSEadopts a Box-Cox transformation).- base
Base used with the
log()function ifpxorpyis0.- q.type
An integer between 1 and 9 selecting one of the nine quantile algorithms used to generate inner shaded region. (See
quantiletile function).- show.par
Boolean determining if power parameter should be displayed.
- grey
Grey level to apply to plot elements (0 to 1 with 1 = black).
- pch
Point symbol type.
- p.col
Color for point symbol.
- p.fill
Point fill color passed to
bg(Only used forpchranging from 21-25).- size
Point size (0-1)
- alpha
Point transparency (0 = transparent, 1 = opaque). Only applicable if
rgb()is not used to define point colors.- inner
Fraction of the input data considered as "mid values". Defaults to 75%. Used to define shaded region boundaries,
q, or to identify which of the tail-end points are to be symbolized differently,tails.- q
Boolean determining if
innerdata region should be shaded.- qcol
Fill color of inner quantile box.
- tails
Boolean determining if points outside of the
innerregion should be symbolized differently. Tail-end points are symbolized via thetail.pch,tail.p.colandtail.p.fillarguments.- tail.pch
Tail-end point symbol type (See
tails).- tail.p.col
Tail-end color for point symbol (See
tails).- tail.p.fill
Tail-end point fill color passed to
bg(Only used fortail.pchranging from 21-25).- xlab
X label for output plot. Ignored if
xis a dataframe.- ylab
Y label for output plot. Ignored if
xis a dataframe.- title
Title to add to plot.
- t.size
Title size.
- plot
Boolean determining if plot should be generated.
- ...
Not used
Details
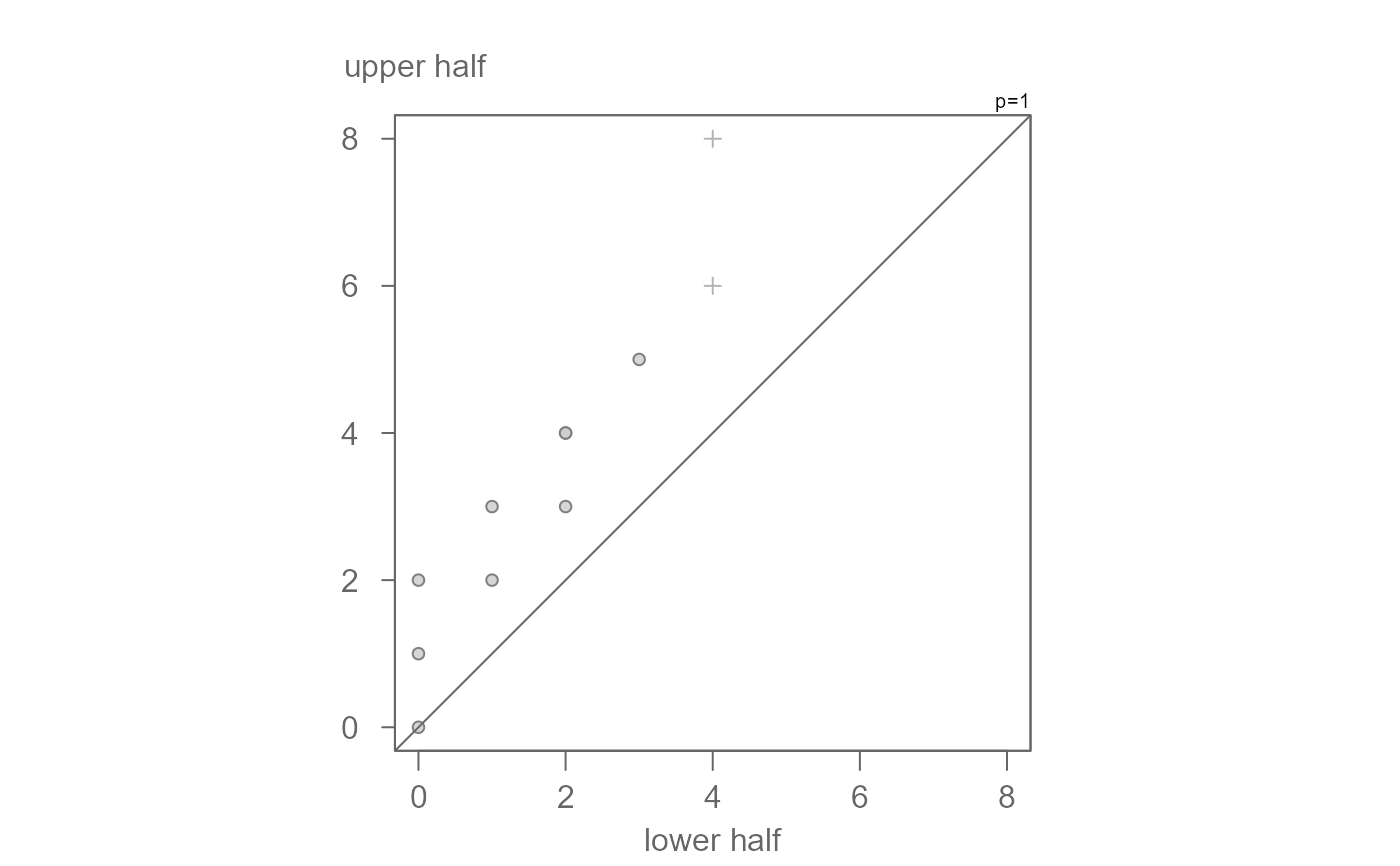
Generates a symmetry quantile plot that compares the lower half of the sorted data to its upper half. If the distribution is perfectly symmetrical, the points will fall on the line.
References
John M. Chambers, William S. Cleveland, Beat Kleiner, Paul A. Tukey. Graphical Methods for Data Analysis (1983)
Examples
singer <- lattice::singer
tenor1 <- subset(singer, voice.part == "Tenor 1", select = height, drop = TRUE )
# Default plot
eda_sym(tenor1)
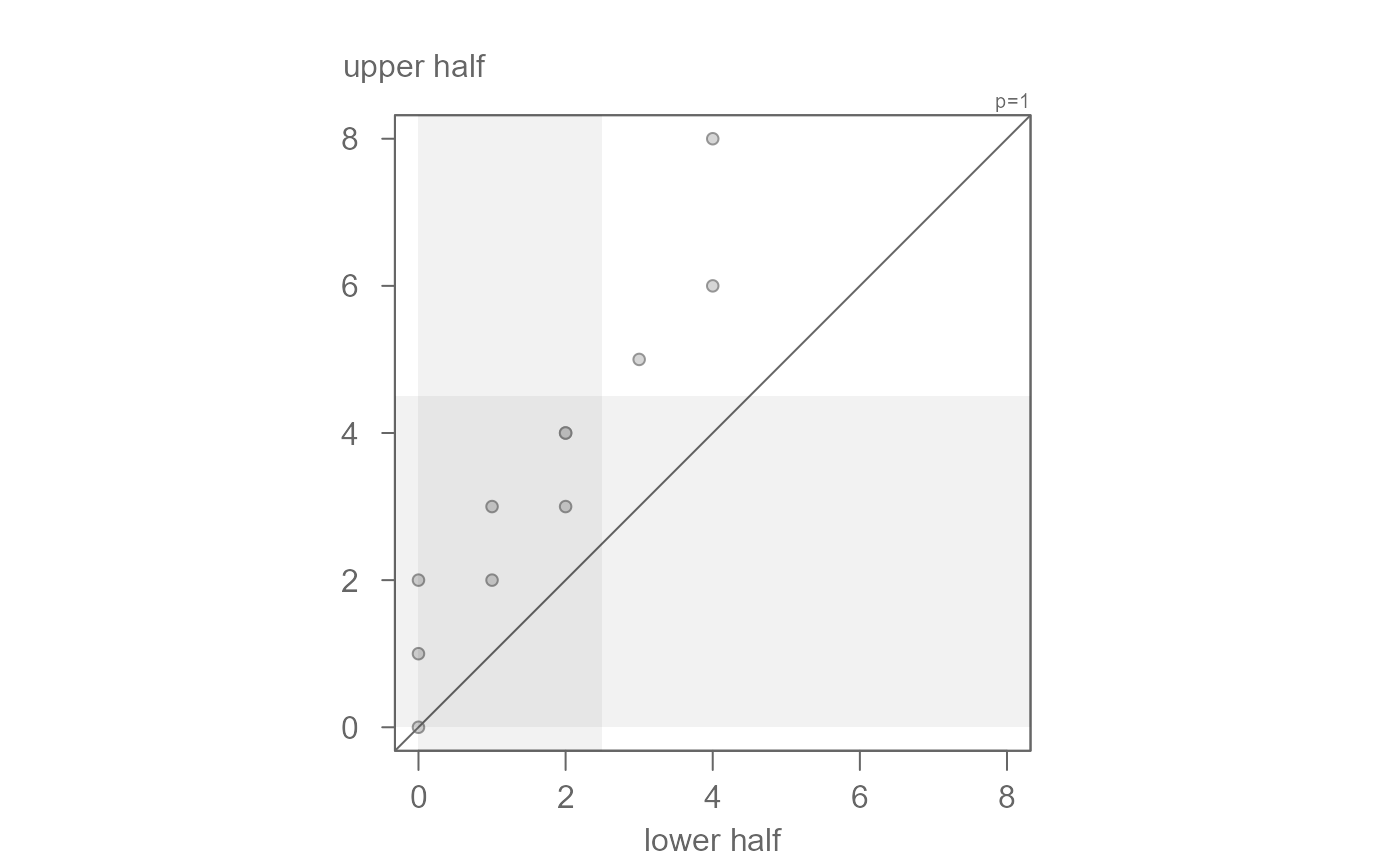 # To remove inner region grey box set q to FALSE
eda_sym(tenor1, q = FALSE)
# To remove inner region grey box set q to FALSE
eda_sym(tenor1, q = FALSE)
 # You can also choose to have the points outside of the inner region
# symbolized differently
eda_sym(tenor1, q = FALSE, tails = TRUE, tail.pch = 3)
# You can also choose to have the points outside of the inner region
# symbolized differently
eda_sym(tenor1, q = FALSE, tails = TRUE, tail.pch = 3)