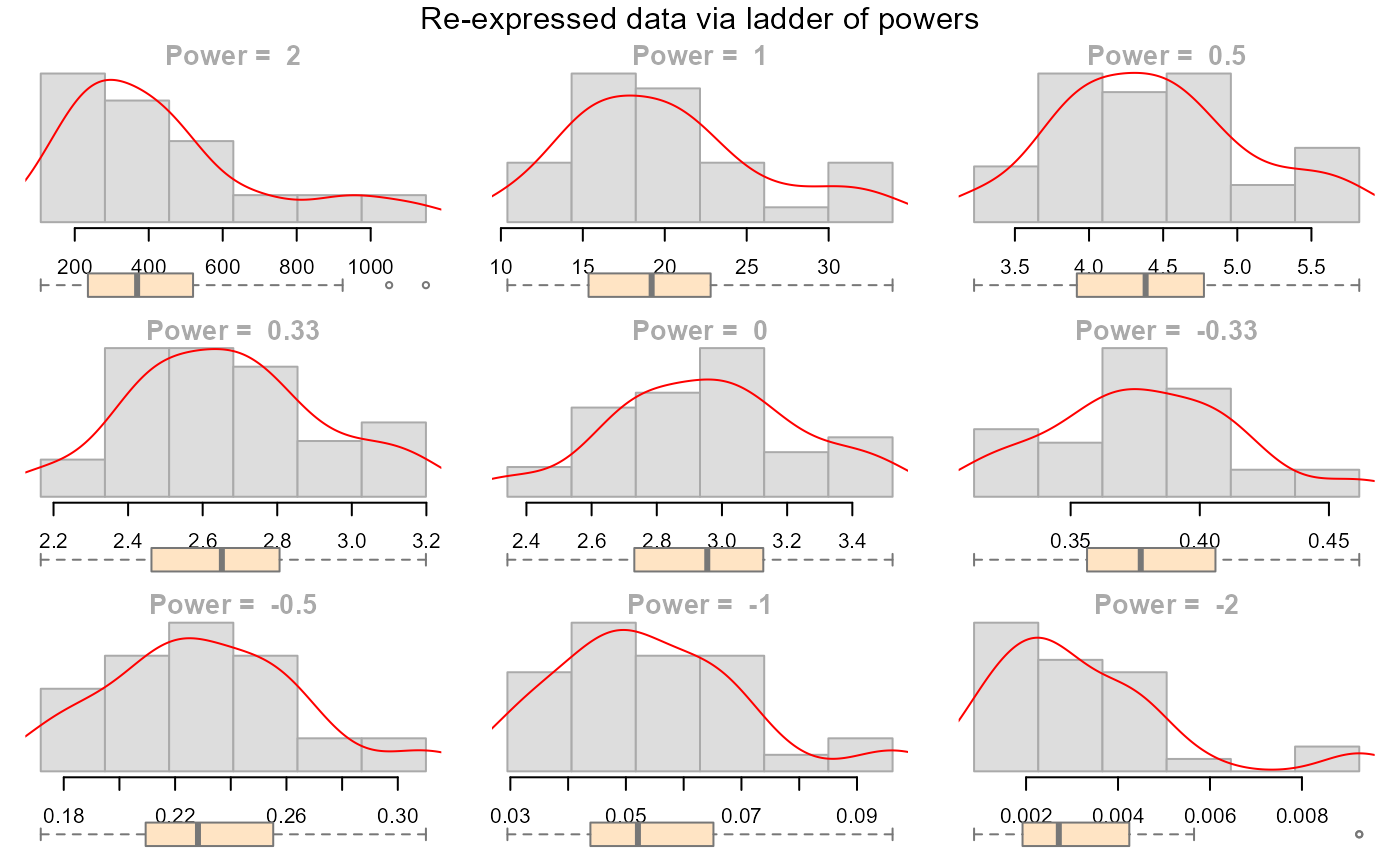
eda_unipow re-expresses a vector on the ladder of powers
and plots the results using a histogram and a density function. Either the
Tukey or Box-Cox transformation is used in computing the re-expressed
values.
Arguments
- x
Vector
- p
Vector of powers
- tukey
If TRUE, apply Tukey's power transformation. If FALSE adopt Box-Cox transformation
- base
Base used with the
log()function ifp = 0.- bins
Number of histogram bins
- cex.main
Histogram title size (assigned to each histogram plot)
- col
Histogram fill color
- border
Histogram border color
- title
Overall plot title (set to NULL for no title)
- ...
Other parameters passed to the graphics::hist function.
Details
The output is a lattice of descriptive plots showing the transformed data
across different powers.
Examples
data(mtcars)
eda_unipow(mtcars$mpg, bins=6, tukey = TRUE)