Presidential Election Results for Franklin D. Roosevelt (1932-1944)
Source:R/feav_data.R
feav1_5.RdThis dataset contains results from presidential elections in which Franklin
D. Roosevelt was elected, covering the years 1932, 1936, 1940, and 1944. The
data are organized into 13 distinct groupings of states with three states
represented within each grouping. Data are pulled from table 1-5 of the
referenced source.
Each numerical entry in votes is the ratio of the votes for
Roosevelt to the sum of votes for Roosevelt and his Republican
opponent (scaled by x1000).
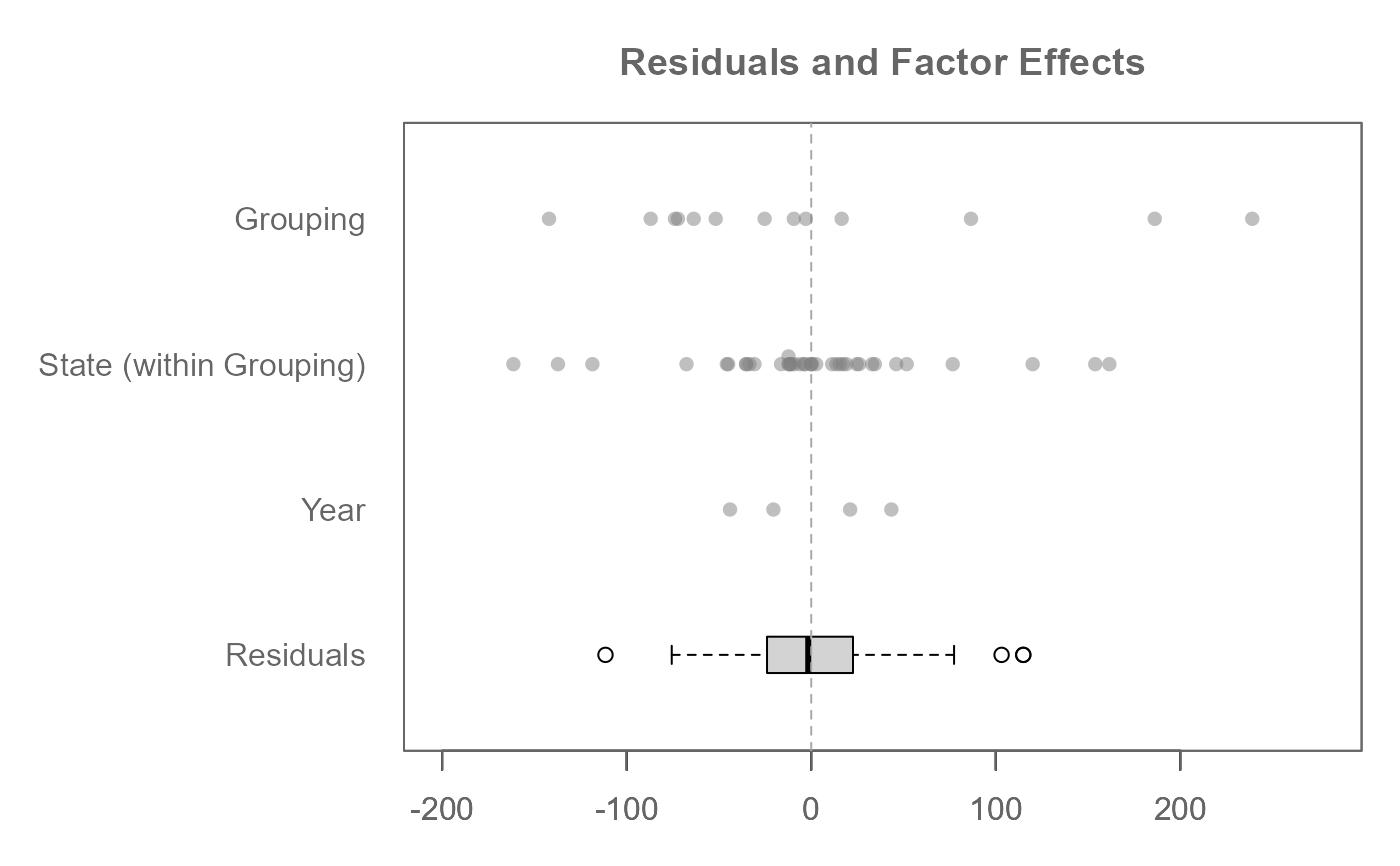
The dataset serves as an example of a two-way, nested, dataset with the
State votes nested under separate Grouping regions.
Format
A data.frame with 156 rows and the following columns:
- Grouping
A factor variable (1-13) indicating the specific grouping of states.
- State
A character string representing the name of the state within each grouping.
- Year
A factor of the election year.
- votes
An integer of the ratio of votes (x1000) carried by Roosevelt. This is the primary response variable.
Source
Hoaglin, D. C., Mosteller, F., & Tukey, J. W. (1991). Fundamentals of Exploratory Analysis of Variance. Wiley.
Examples
M0 <- eda_mean_sweep(feav1_5, votes, State, Year, Grouping, nesting = c("Grouping", "State"))
plot(M0,  rotate = TRUE)