This dataset contains the weight gain (in grams) of
rats subjected to different dietary treatments. Data are pulled from table
5-12 of the referenced source.
This dataset serves as an example of a two-way table with (balanced)
replicates (10 replicates per Level and Type combinations).
Format
A data.frame with 60 rows and the following columns:
- Level
A character indicating the amount of protein. Either
HighorLow.- Type
A character indicating the specific diet administered to each group of rats.
- Weight
An integer vector representing the weight gain, in grams, for each rat. This is the response variable.
Source
Hoaglin, D. C., Mosteller, F., & Tukey, J. W. (1991). Fundamentals of Exploratory Analysis of Variance. Wiley.
Examples
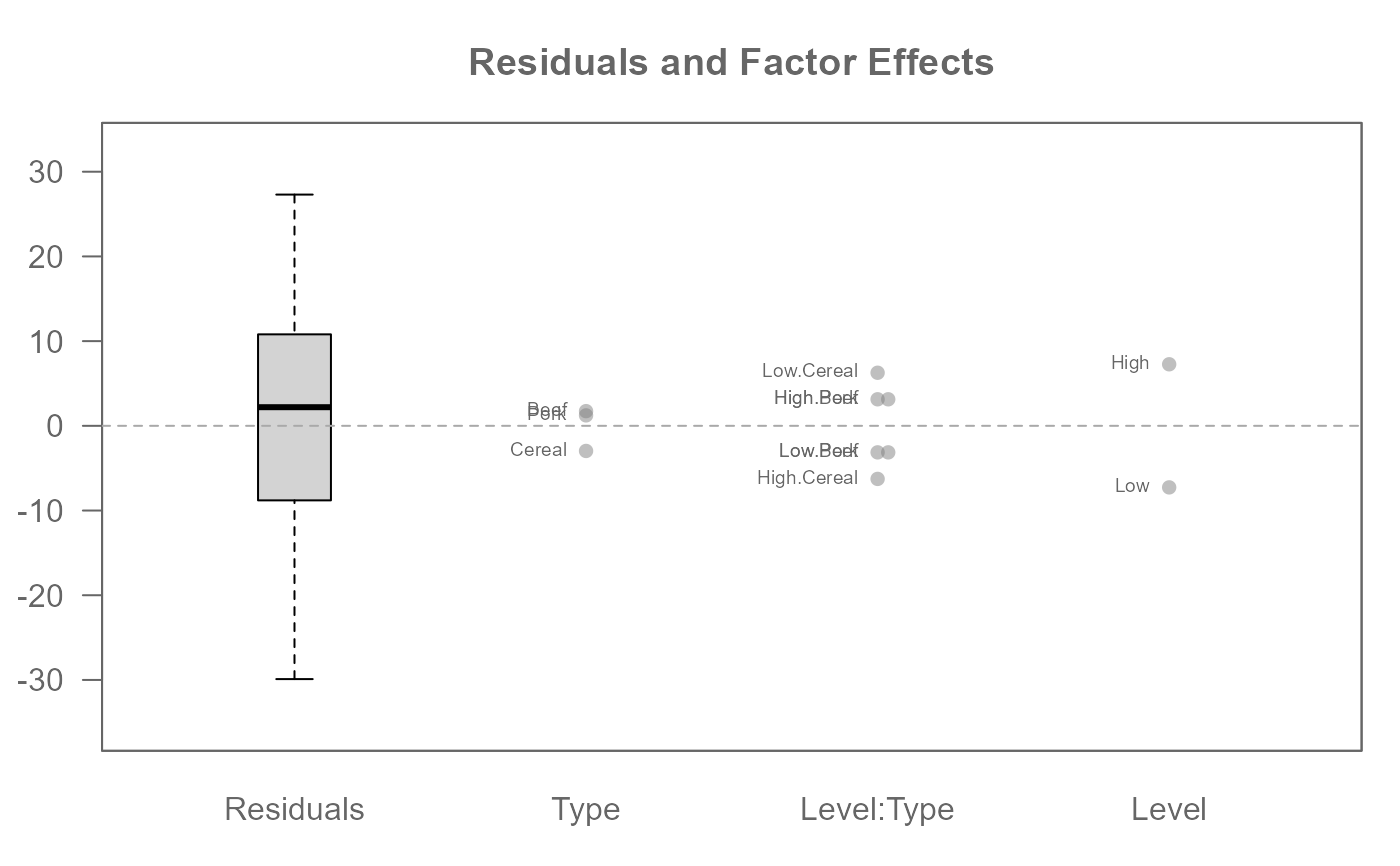
# Include second level interactions
M0 <- eda_mean_sweep(feav5_12, Weight, Level, Type, max_order = 2)
plot(M0, label = TRUE)