| tukeyedar |
|---|
| 0.5.0 |
40 Supporting Functions
This chapter introduces a collection of general-purpose utility functions that are used throughout the course. These functions are not tied to a single topic; instead, they support common tasks that arise across many areas of data analysis. Students are encouraged to become familiar with these tools, as they will be useful in practical assignments. These tools are available in the course’s tukeyedar package.
40.1 Shuffle values across groups
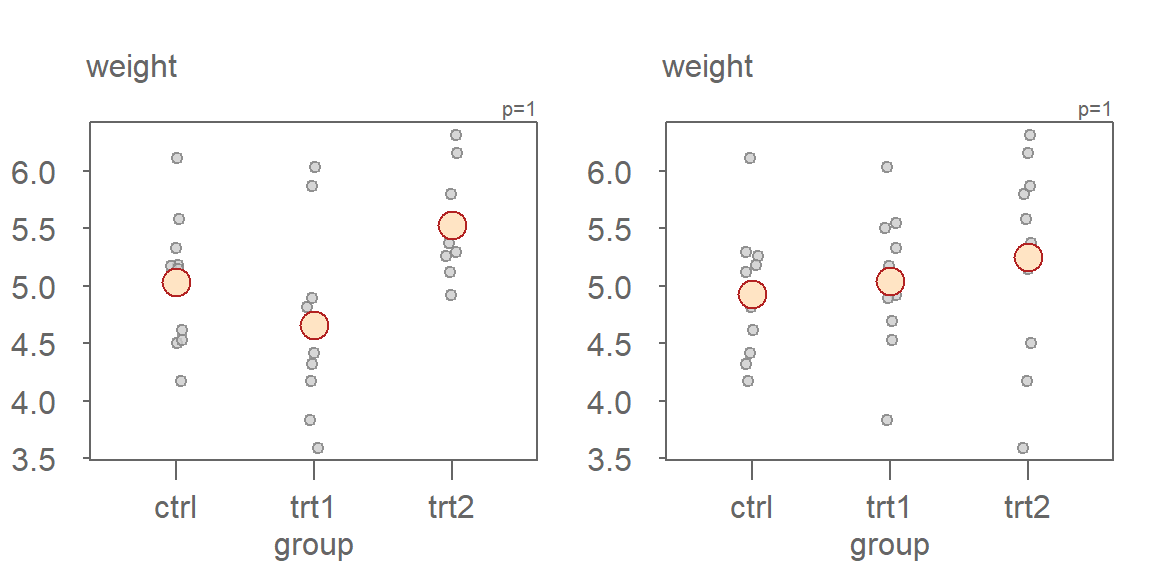
The eda_shuffle function randomly permutes the values in a specified column of a data frame across all groups, while preserving the group structure.
For example, to shuffle the weight values in the PlantGrowth dataset across the group variable, type:
library(tukeyedar)

plant_shuffle <- eda_shuffle(PlantGrowth, weight, group)
The jitter plots below show the original dataset (left), and the shuffled dataset (right).
40.2 Simulate data
The eda_sim() function generates random data with the specified skewness and excess kurtosis using the Fleishman transformation method.
An example of a simulated Normal distribution:
x <- eda_sim(10000, skew = 0, kurt = 0)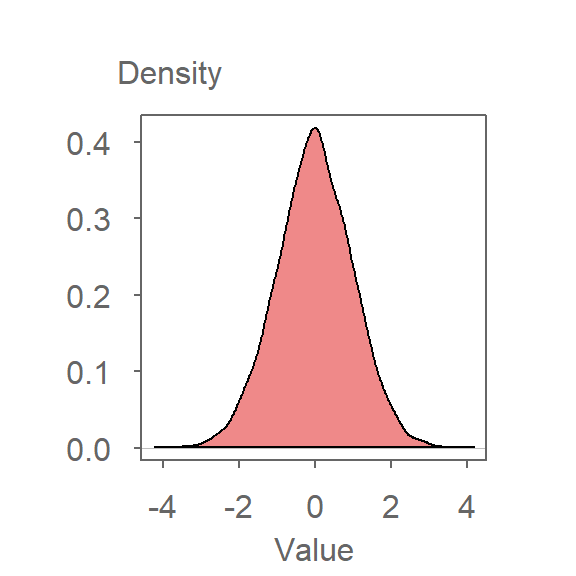
An example of a simulated peaked distribution:
x <- eda_sim(10000, skew = 0, kurt = 3)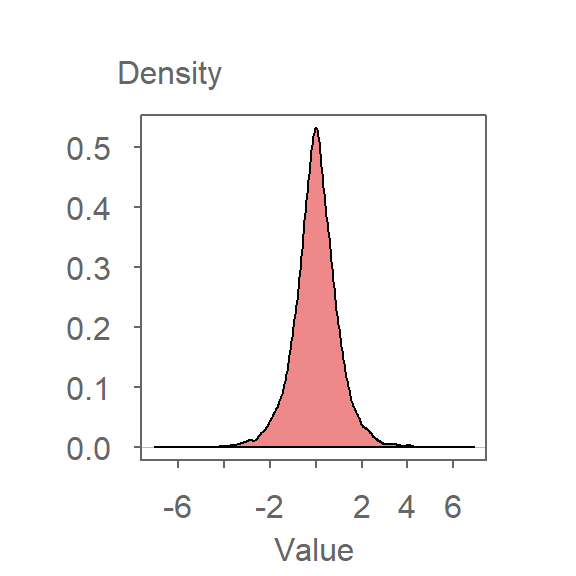
An example of a simulated right-skewed distribution:
x <- eda_sim(10000, skew = 1.15, kurt = 2)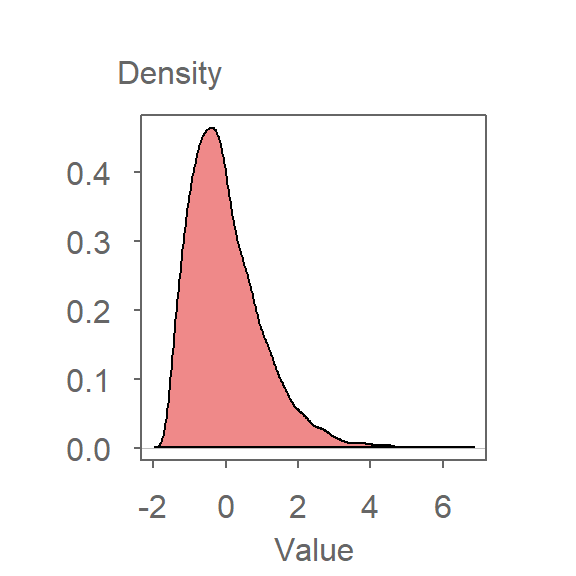
An example of a simulated left-skewed distribution:
x <- eda_sim(10000, skew = -1.15, kurt = 2)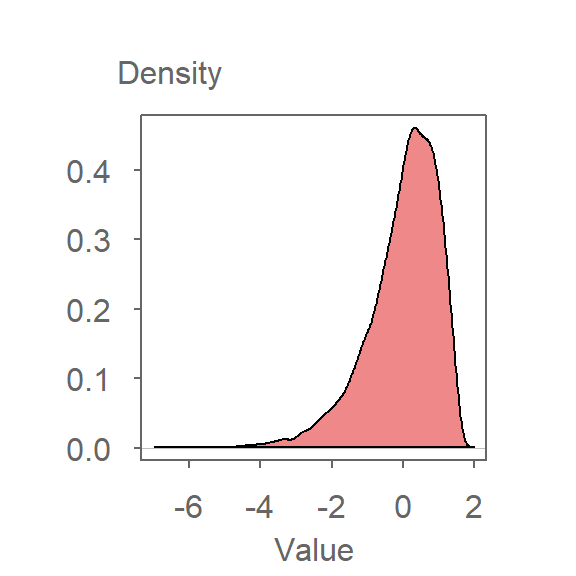
NOTE: The allowable range of skewness is restricted to −3 to 3. The minimum permissible value of excess kurtosis depends on the skewness and is constrained by -1.13168 + 0.9 + 1.58837 * skew ^ 2
40.3 Trim vector
The eda_trim() function trims a vector by either a specified number of observations or a specified proportion from both tails.
For example, to remove the bottom and top 10% of values in x, type:
x <- 1:20
eda_trim(x, prop = 0.1)
[1] 3 4 5 6 7 8 9 10 11 12 13 14 15 16 17 1840.4 Trim dataframe
The eda_trim_df() function trims a dataframe by number or by proportion based on the values of a specified column.
For example, to remove the bottom 25% and highest 25% of observations in mtcars based on mpg (i.e., to extract the interquartile range), type:
eda_trim_df(mtcars, mpg, prop=0.25) mpg cyl disp hp drat wt qsec vs am gear carb
Dodge Challenger 15.5 8 318.0 150 2.76 3.520 16.87 0 0 3 2
Ford Pantera L 15.8 8 351.0 264 4.22 3.170 14.50 0 1 5 4
Merc 450SE 16.4 8 275.8 180 3.07 4.070 17.40 0 0 3 3
Merc 450SL 17.3 8 275.8 180 3.07 3.730 17.60 0 0 3 3
Merc 280C 17.8 6 167.6 123 3.92 3.440 18.90 1 0 4 4
Valiant 18.1 6 225.0 105 2.76 3.460 20.22 1 0 3 1
Hornet Sportabout 18.7 8 360.0 175 3.15 3.440 17.02 0 0 3 2
Merc 280 19.2 6 167.6 123 3.92 3.440 18.30 1 0 4 4
Pontiac Firebird 19.2 8 400.0 175 3.08 3.845 17.05 0 0 3 2
Ferrari Dino 19.7 6 145.0 175 3.62 2.770 15.50 0 1 5 6
Mazda RX4 21.0 6 160.0 110 3.90 2.620 16.46 0 1 4 4
Mazda RX4 Wag 21.0 6 160.0 110 3.90 2.875 17.02 0 1 4 4
Hornet 4 Drive 21.4 6 258.0 110 3.08 3.215 19.44 1 0 3 1
Volvo 142E 21.4 4 121.0 109 4.11 2.780 18.60 1 1 4 2
Toyota Corona 21.5 4 120.1 97 3.70 2.465 20.01 1 0 3 1
Datsun 710 22.8 4 108.0 93 3.85 2.320 18.61 1 1 4 1
Merc 230 22.8 4 140.8 95 3.92 3.150 22.90 1 0 4 2