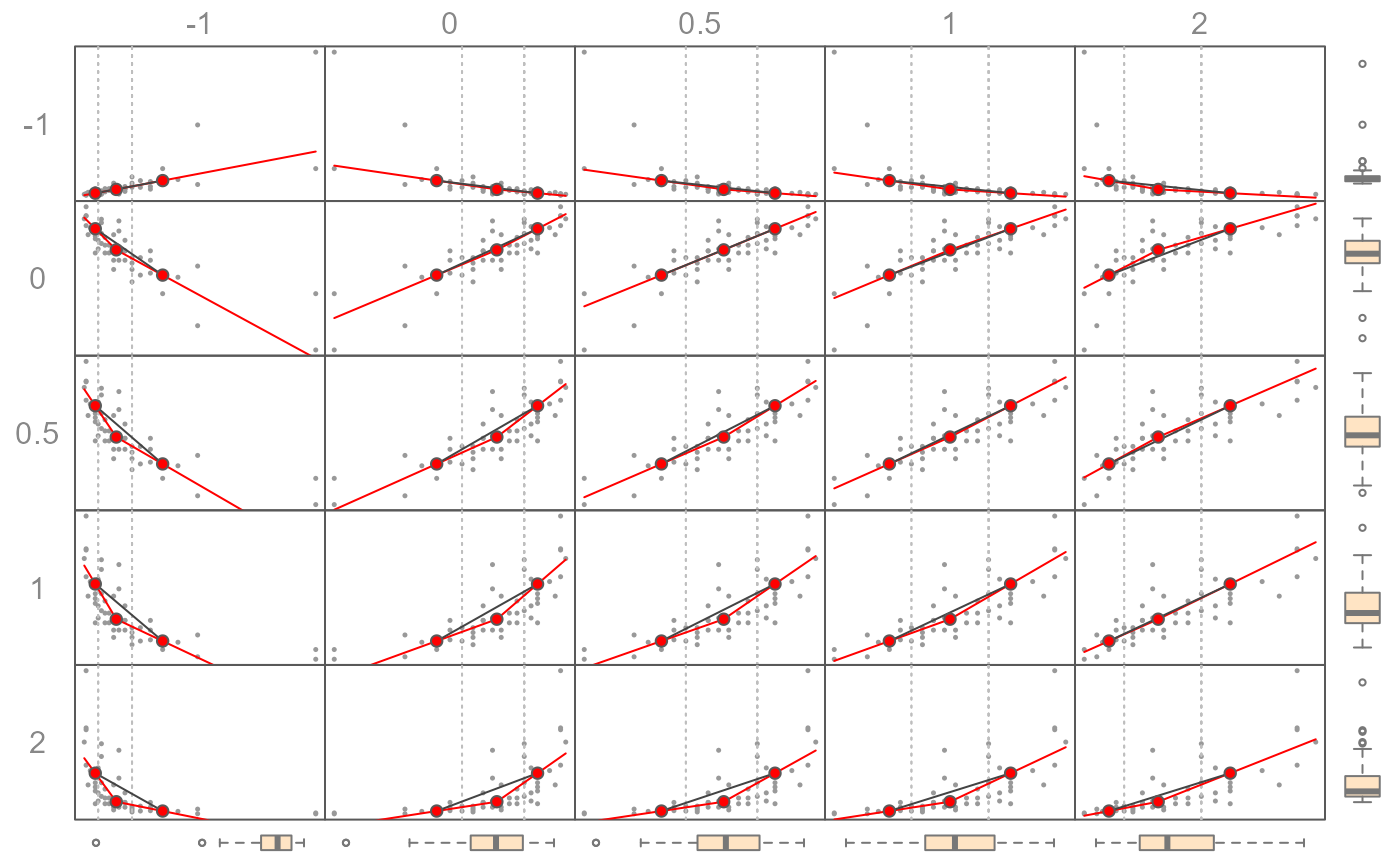
Ladder of powers transformation on bivariate data with three-point summary plot
Source:R/eda_bipow.R
eda_bipow.RdRe-expresses a vector on the ladder of powers.
Requires eda_3pt() function.
Arguments
- dat
Dataframe.
- x
Variable assigned to the x axis.
- y
Variable assigned to the y axis.
- p
Vector of powers.
- tukey
If set to TRUE, then adopt Tukey's power transformation. If FALSE, adopt Box-Cox transformation.
- base
Base used with the
log()function ifp = 0.- ...
Other parameters passed to the graphics::plot function.
Details
Generates a matrix of scatter plots and boxplots of various
re-expressions of both x and y values. The 3-point summary and
associated half-slopes are also plotted (this function makes use
of the eda_3pt function). The values are re-expressed using either
the Tukey power transformation or the Box-Cox transformation (the default).
See eda_re for more information on these transformation techniques.
Axes labels are omitted to reduce plot clutter.