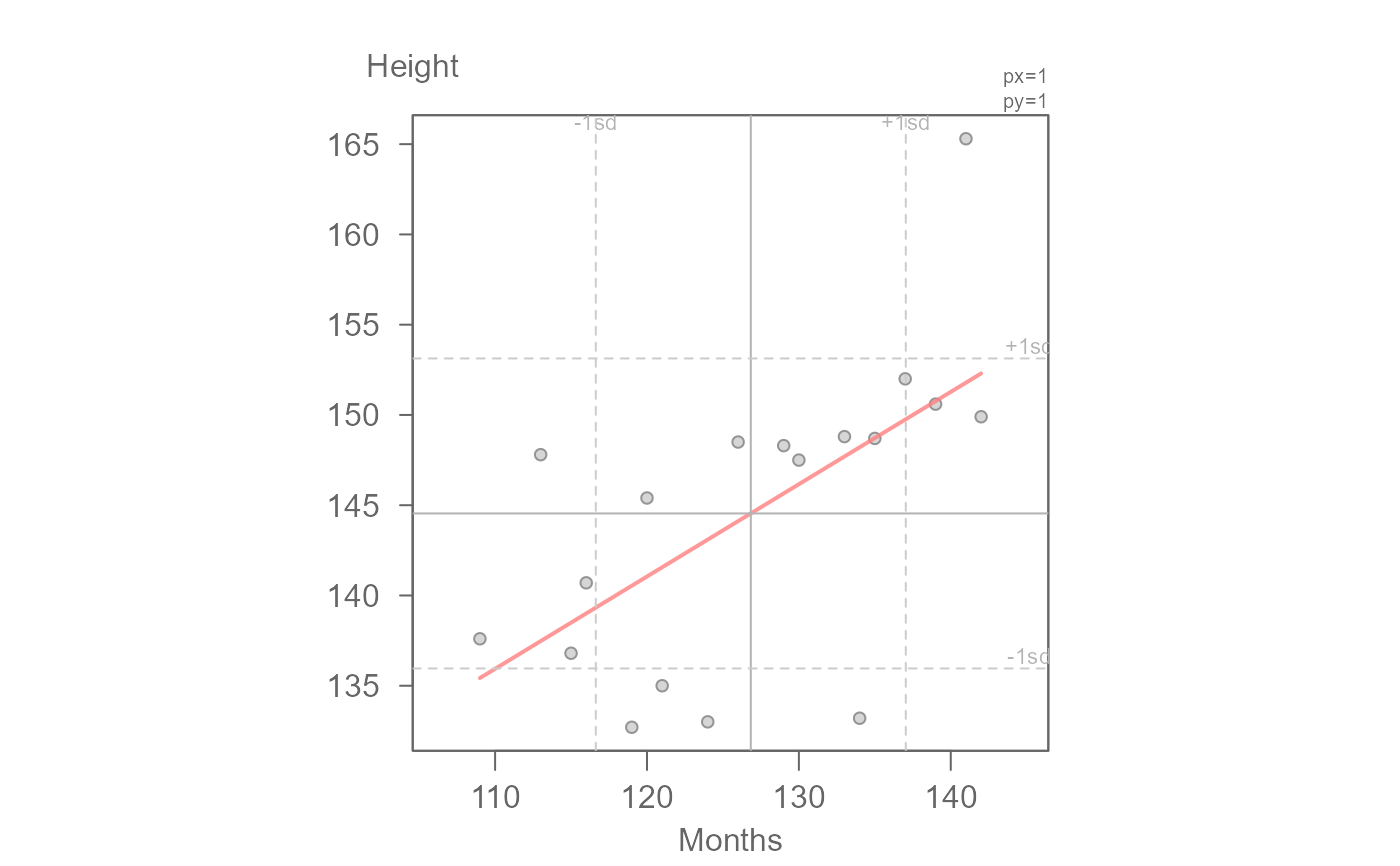
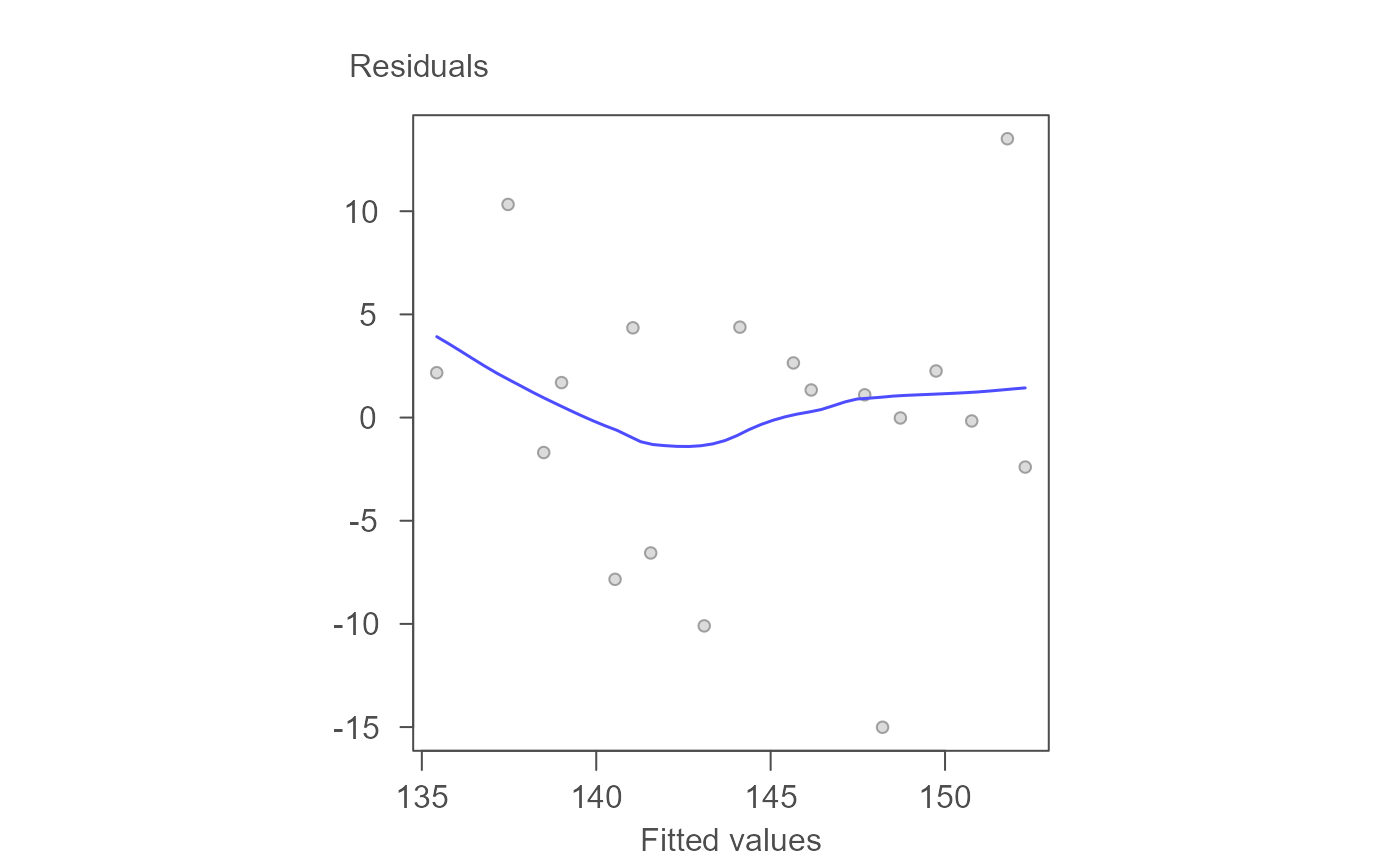
Generate residuals vs fitted or residuals vs dependence plot from
an eda_lm class object.
Usage
# S3 method for class 'eda_lm'
plot(x, plot = "rd", xlab = NULL, ylab = NULL, loe = TRUE, sd = FALSE, ...)
Arguments
- x
Object of class
eda_lm.- plot
Type of residuals plot. Choice between residuals-fit (
rf) and residuals-dependence (rd) plots.- xlab
X label for output plot.
- ylab
Y label for output plot.
- loe
Logical; whether to plot loess smooth line.
- sd
Logical; whether to show ±1 SD lines.
- ...
Arguments passed on to
.eda_plot_xydatOptional data frame containing
xandy.yA numeric vector or column name in
datfor the y-axis.pxPower transformation used in the input data to display if
show.par = TRUE.pyPower transformation used in the input data to display if
show.par = TRUE.baseBase used with the log() function if
pxorpyis0.tukeyBoolean determining if a Tukey transformation should be adopted (FALSE adopts a Box-Cox transformation).
raw_tickLogical. If
TRUE, original (untransformed) equally spaced tick values are displayed on the re-expressed axes.xlimX-axis range.
ylimY-axis range.
show.parLogical; whether to display plot parameter summary on the plot. Currently only applies to regression model input.
regLogical; whether to fit and display a regression line.
polyInteger; regression model polynomial degree (defaults to 1 for linear model).
robustLogical; if
TRUE, uses robust regression (MASS::rlm).rlm.dList; parameters for
MASS::rlm, (e.g.,list(psi = "psi.bisquare")).wOptional numeric vector of weights for regression.
lm.colRegression line color.
lm.lwNumeric; Regression line width.
lm.ltyNumeric; Regression line type.
mean.lLogical; whether to show x and y mean reference lines.
aspLogical; whether to preserve the aspect ratio (ignored if
square = FALSE).squareLogical; whether to create a square plotting window.
greyNumeric between
0-1; controls grayscale background elements (0 = black,1 = white).pchInteger; point symbol.
p.colPoint border color.
p.fillPoint fill color.
sizePoint size.
alphaPoint transparency level (0 = 100\% transparent, 1 = 100\% opaque).
qLogical; whether to draw inner quantile boxes (quantile shading).
q.typeInteger; type of quantile calculation (see
quantile).innerNumeric; defines the inner fraction of values to highlight with quantile shading.
qcolFill color of quantile shading.
loe.lwNumeric; Loess smooth line width.
loe.colLoess smooth color.
loe.ltyNumeric; Loess smooth line type.
loess.dList; parameters for
loess.smooth, e.g.,list(span = 0.7, degree = 1).statsLogical; if
TRUE, displays model statistics (R², β, p-value).stat.sizeText size for
statsplot display.hlineNumeric; location(s) of additional horizontal reference lines. Can be passed via the
c()function.vlineNumeric; location(s) of additional vertical reference lines. Can be passed via the
c()function.
Value
Returns the margins (mar) used to generate the plot via the
par() function. This parameter can be set with a subsequent call to
par() if additional elements are to be added to the plot.