A plot method for lists of eda_rline class.
Usage
# S3 method for class 'eda_rline'
plot(
  x,
  plot = "model",
  xlab = NULL,
  ylab = NULL,
  model = TRUE,
  pt3 = TRUE,
  seg = TRUE,
  fit = TRUE,
  fit.col = rgb(1, 0, 0),
  grey = 0.6,
  sd = FALSE,
  mean.l = FALSE,
  reg = FALSE,
  lm.col = rgb(0.7, 0.7, 1, 0.8),
  lm.lty = 2,
  loe = NULL,
  loe.col = rgb(0.7, 0.7, 1, 0.8),
  loe.lty = 2,
  ...
)
Arguments
- x
Object of class
eda_rline.- plot
Plot type. One of two: "model", "residuals".
- xlab
Custom x-axis label. Defaults to column name.
- ylab
Custom y-axis label. Defaults to column name.
- model
Logical; whether to show the resulting model above plot. Only applies to
type = "model".- pt3
Logical; whether to show the 3-pt summaries. Only applies to
type = "model".- seg
Logical; whether line segments showing partitioning of x variables should be displayed.
- fit
Logical; whether to show the resistant fitted line.
- fit.col
Resistant line color.
- grey
Numeric between 0–1; controls grayscale background elements (0 = black, 1 = white).
- sd
Logical; whether to show ±1 SD lines.
- mean.l
Logical; whether to show mean reference lines.
- reg
Logical; whether to fit and display an OLS regression line.
- lm.col
OLS regression line color (only applicable if
reg = TRUE.- lm.lty
OLS regression line line type (only applicable if
reg = TRUE.- loe
Logical; whether to plot loess smooth line.
- loe.col
loess smooth line color (only applicable if
loe = TRUE.- loe.lty
loess smooth line type (only applicable if
loe = TRUE.- ...
Arguments to be passed to
.eda_plot_xy.
Value
Returns the margins (mar) used to generate the plot via the
par() function. This parameter can be set with a subsequent call to
par() if additional elements are to be added to the plot.
Examples
r.lm <- eda_rline(age_height, Months, Height)
plot(r.lm)
 plot(r.lm, pt3 = FALSE)
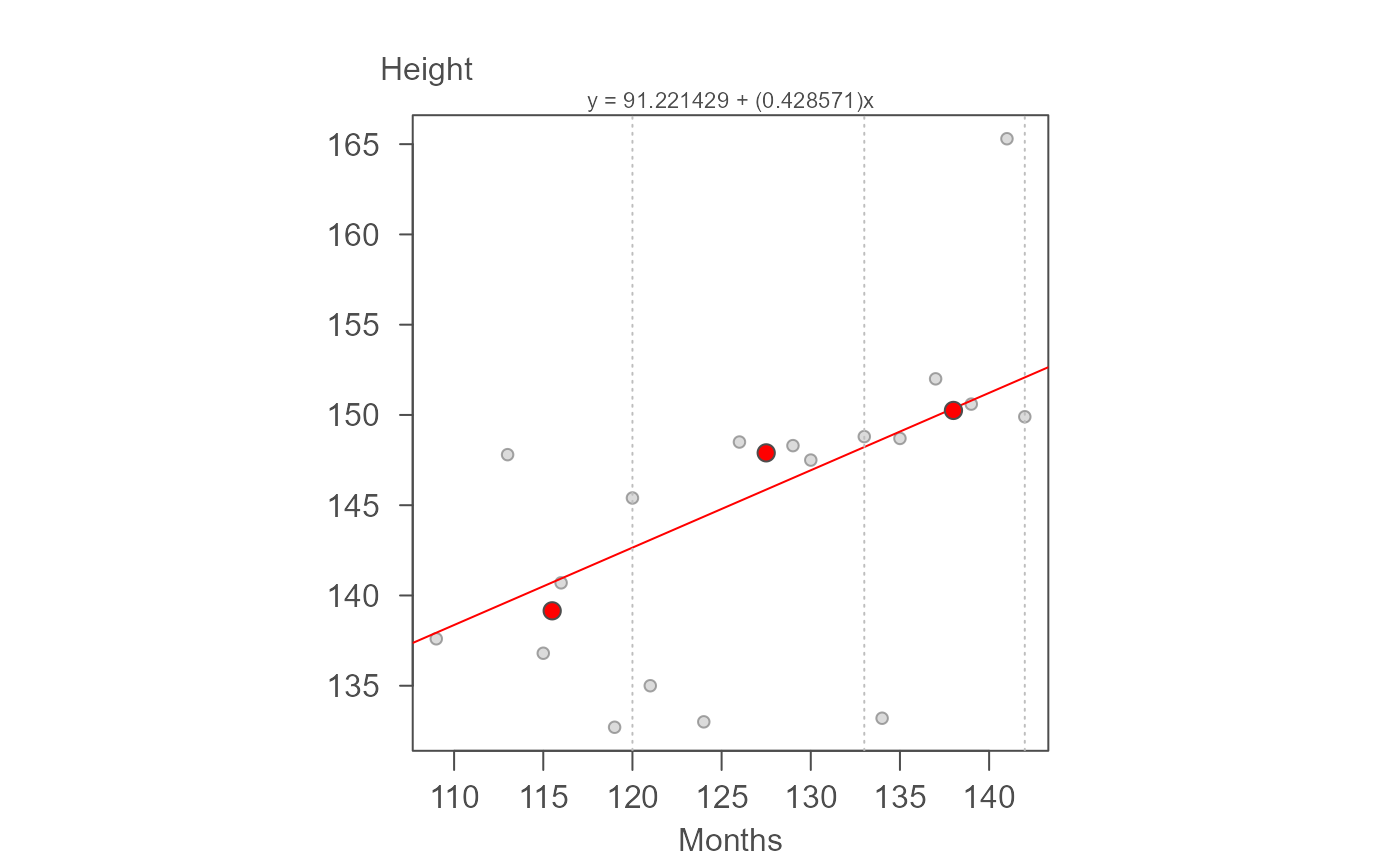
 # And an OLS regression line for comparison (defaults to blue dashed line)
plot(r.lm, reg = TRUE)
# And an OLS regression line for comparison (defaults to blue dashed line)
plot(r.lm, reg = TRUE)
 #> int Months^1
#> 79.6962314 0.5112868
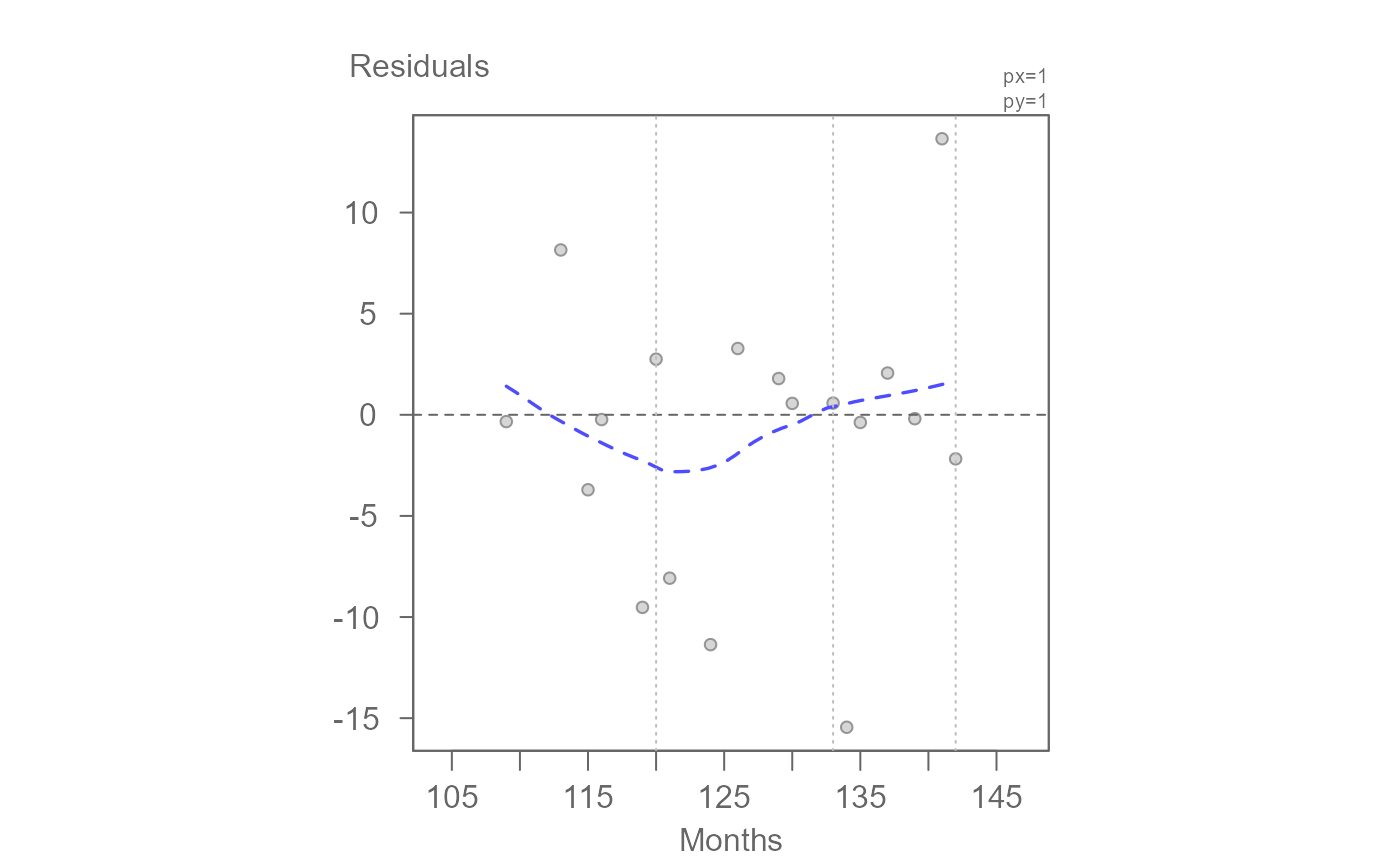
# Plot residuals vs dependence plot. A Loess smooth is fitted to the data.
plot(r.lm, plot = "residuals")
#> int Months^1
#> 79.6962314 0.5112868
# Plot residuals vs dependence plot. A Loess smooth is fitted to the data.
plot(r.lm, plot = "residuals")